27th day of $QQQ short term up-trend; Head and Shoulders top in $AAPL? Tuesday, November 10, 2015Wednesday, November 11, 2015 @ 9:15 pm by Dr. Wish GMI5/6 GMI-22/9 T210856% This weekly chart of AAPL is very ominous for Apple and the entire market. A break of the neckline would have a target price of near $80. Share this: Email a link to a friend (Opens in new window) Email Share on Facebook (Opens in new window) Facebook Share on X (Opens in new window) X Share on LinkedIn (Opens in new window) LinkedIn Print (Opens in new window) Print More Share on Pinterest (Opens in new window) Pinterest Share on Tumblr (Opens in new window) Tumblr Share on Reddit (Opens in new window) Reddit Share on Telegram (Opens in new window) Telegram Share on WhatsApp (Opens in new window) WhatsApp Related
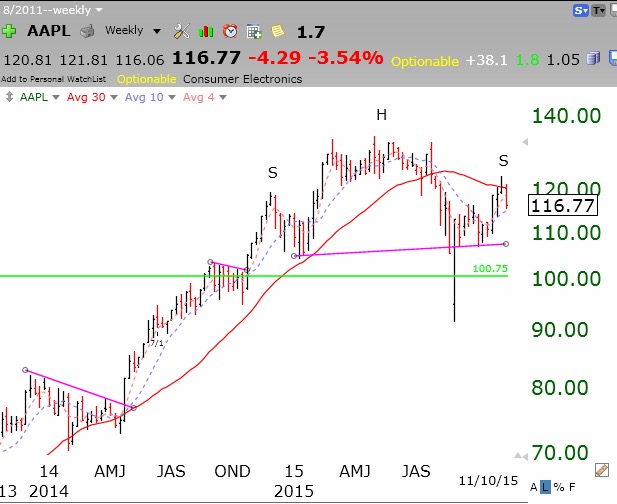
could you please describe/explain your placement of the neckline on this chart of AAPL?
I drew a line at support, excluding recent flash crash.