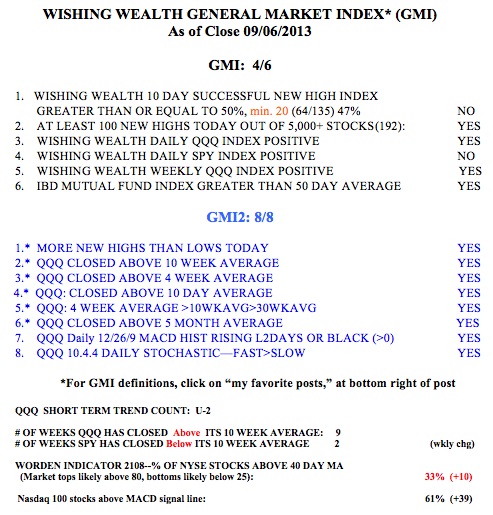
While I have remained scared of this market, given the possible attack in Syria, the tough month of September, and all of the budget decisions coming at the end of the federal government’s fiscal year, my market indicators show a strong market. Friday was the second day of the new QQQ short term up-trend (U-2). Furthermore, 61% of the Nasdaq 100 stocks have a MACD above its signal line, a sign of short term strength and up from 22% last Friday. The Worden T2108 has rebounded to 33% from a low of 23% reached last Friday. All 8 indicators in the GMI2 are positive. In this business, one trades against the market trend at one’s peril. The market is usually right, opinions are often wrong. So maybe this market is saying that regardless of whether the U.S. attacks Syria, the national economy will be fine. Or maybe it is saying there will be no attack?
I have often said that a green line break-out of a stock to an all-time high can be a powerful signal of strength to come. I have also noted that an all-time high after a long base in a stock that has come public in the recent past can be a special sign of future strength. Well, nothing changes in the stock market. In his book written in 1940, the great Jesse Livermore wrote, when talking about pivotal points:
“For instance, let us say that a new stock has been listed in the last two or three years and its high was 20, or any other figure, and that such a price was made two or three years ago. If something favorable happens in connection with the company, and the stock starts upward, usually it is a safe play to buy the minute it touches a brand new high.” (Livermore, J.L., How to Trade in Stocks, 1940) In talking about pivotal points, the exact time to buy a stock, he warns that one must wait for the break out to a new high and not buy before, in anticipation of the break-out. Second, if the stock does not act well after breaking to a new high, one should get out. When a stock does not behave as one expected, get out and re-assess.
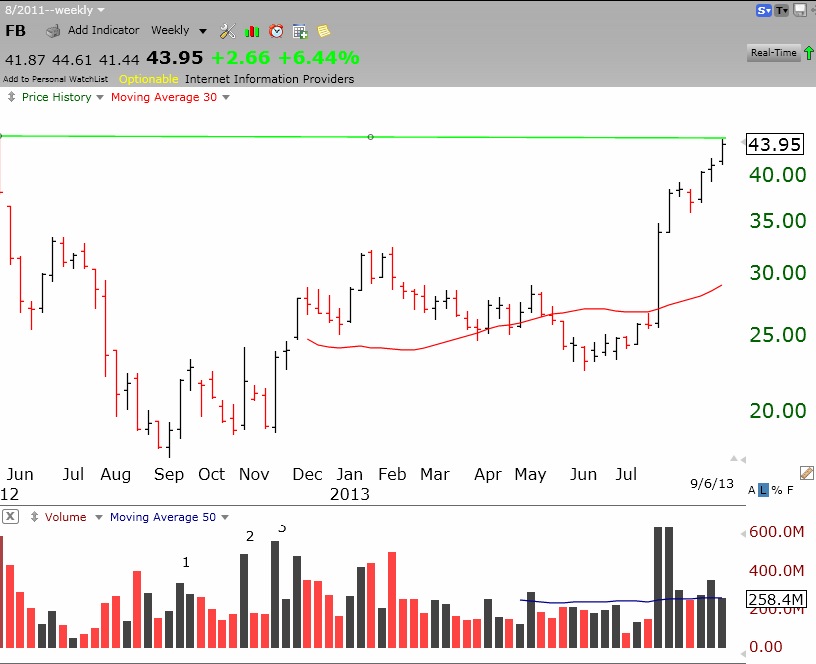
Livermore was describing my concept of a green line break-out, a stock that trades at an all-time high after trading for many months below its all-time high. This is why I am excited about FB. FB came public over a year ago, rose to $45 and then stayed below that level for many months. Then the good news came in the form of rising earnings and the stock started up on high volume. Last week FB traded as high as $44.61. If FB can close above $45, I will begin to accumulate and hold it as long as it stays above $45. Below is the weekly chart of FB, with its green line top drawn in. It is also conceivable that many persons will sell or short the stock at $45, expecting it to meet resistance again at its old top, and FB will consolidate at this level before moving higher.
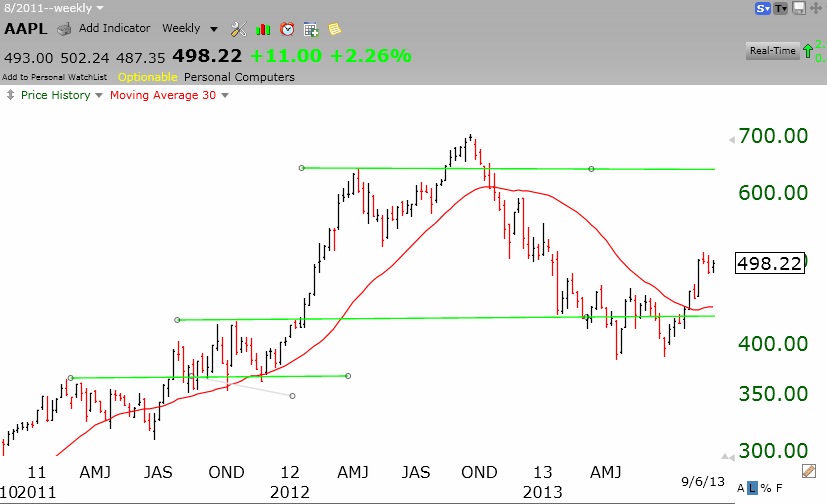
Why is a green line stock at an all-time high a good buy? Many of the people who bought FB in 2012 around $40 and saw it decline to below $20 have been waiting to sell so as to to get their money back as FB climbed. The fact that FB could overcome all of this selling to break through to a new high reflects a huge amount of demand for the stock and suggests more to come. However, a green line break-out failure is a sign to get out quickly until the stock can retake its all-time high or fail. See below what happened when AAPL’s green line break-out failed in October, 2012.
Dr. Wish: yes, it is saying there will be NO attack. But the most difficult decision is HOW to “save face” of current president! The Brits are out, Russians are against it, Canada is indifferent, and Italy only wants more pizza!!