The weekly chart usually provides me with a better picture of the market’s main trend. The weekly chart of the QQQ below clearly shows that this index has been in a Stage 2 up-trend. Note that the index is well above its rising 30 week average (red line). As long as the major indexes show this pattern, I remain 100% invested in my primary university pension accounts. All of the major indexes I follow (QQQ, DIA and SPY) are in Stage 2 up-trends.
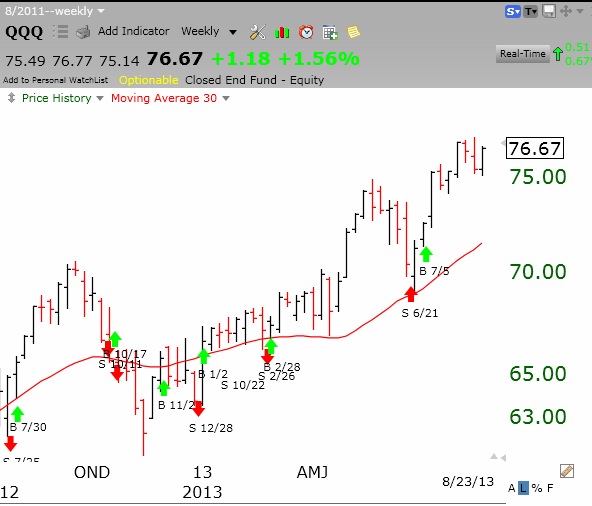
You can also see from this chart all of the recent GMI buy/sell signals. The GMI has been on a Buy since July 5.
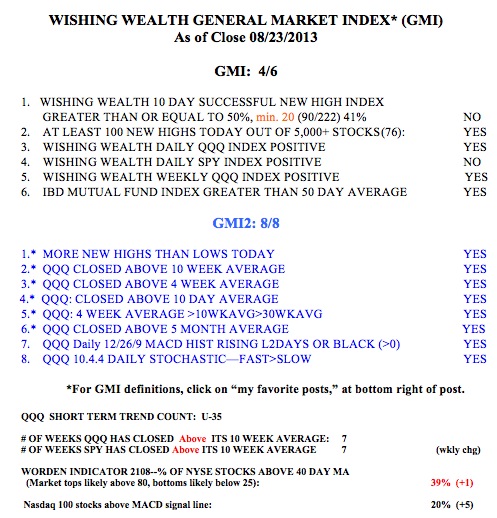
The table below shows the components of the GMI and the GMI2. I have revised the GMI2 by adding two new indicators (7 and 8) that I want to monitor. I use the GMI2 to keep me focused on this set of 8 very technical indicators and not for specific buy/sell signals. Note that the GMI2=8, which means that all of its indicators are positive.
Your QQQ chart above is good. The market has been going up for 4 days, and IBD has not changed their “market in correction”!! The grain of salt applies here, too. I will wait until they change to UPwards, wait two weeks and start selling!