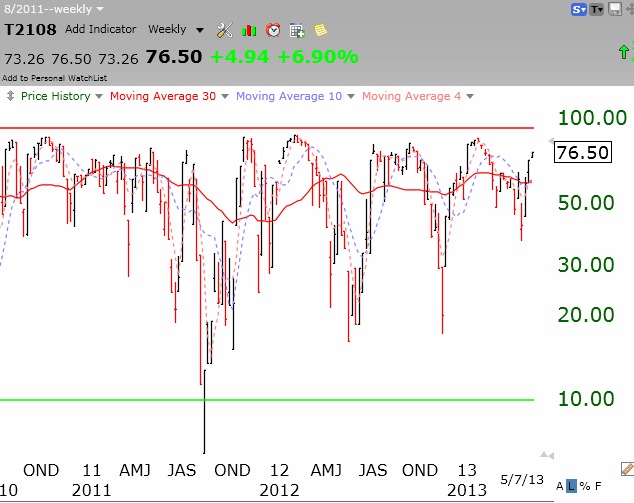
While the trend remains up, I note that the T2108 is becoming extended. This weekly chart of T2108 shows that the market is approaching the area where this indicator tops out–but it can take a while. T2108 measures the percentage of NYSE stocks closing above their average price over the past 40 days. To me, T2108 represents a pendulum of the emotional state of the market, going from one extreme to the other.
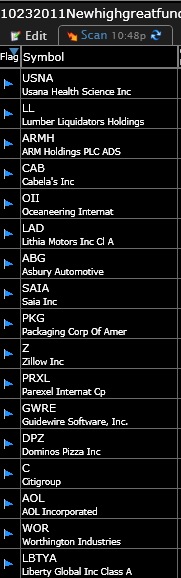
Below is a list of 17 of the 30 stocks that came up in my new high and good recent earnings scan that also had a blue flag. A blue flag on the left means the stock appears in one of my lists of stocks that has been highlighted by IBD.
Hi Dr Wish .
With respect to the T2108, if it calculates the % above Moving average and the % below shouldn’t the be a single solid line plot. It seems the Plot has High low bars showing some variance ..How is this possible unless the plot is taken intraday >?
Thanks
das
You are correct in that there is a singe reading for any day, but I am showing a weekly chart that contains 5 day’s readings.