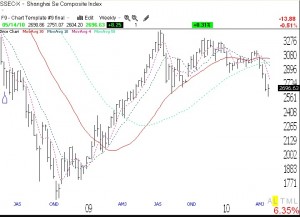
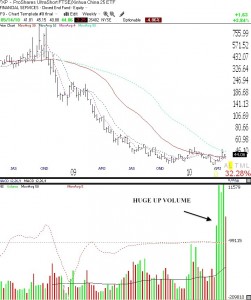
Every once in a while the charts become so bad that they scare me. I check a number of market indicators every night and was concerned by the current steep decline in the Shanghai Composite Index. The weekly chart (and monthly chart, not shown) are very ominous.  After a major decline (almost 70%) from 2007 to 2008, this index began a rebound in which it almost doubled from the bottom, until August of 2009. Since its August top, the Index declined and made another failed attempt to rise, topping out in November, 2009. It then declined again and made one last feeble attempt to rise, topping out in April 2010. When that rally failed, the Index broke down below prior support and now appears to be in a free-fall. Where it will stop is any person’s guess, but we do know that China’s government is trying to cool the economy. In the U.S., when the Fed tries to cool the economy from a boom, it usually ends with disastrous consequences for the market. While I think a crashing China would have disastrous consequences for the rest of the world that has been banking (pun intended) on China to help the world recover from its recession, I can still look for a way to profit from the decline in this Index, if it continues. I have therefore purchased a little of FXP, the Ultra Short ETF that tracks the daily performance of the FTSE/Xinhua China 25 Index. FXP is designed to rise twice as much as this Index falls. I know these ultra ETF’s can be very volatile and I therefore bought a few shares with the idea of adding to my position if the decline continues. What caught my attention was the largest weekly volume of trading in FXP the last few weeks as it started to rise.
  So, the big boys are apparently buying FXP. The volume of shares traded in FXP the past 5 weeks is the highest that it has ever been since this ETF started trading in 2008. My students should see immediately from this weekly chart that this ETF may be completing a Stage 1 base and beginning a new Stage 2 up-trend. It is still too early to know if this is happening, but I thought it was worth taking a small position in FXP, given the recent up volume (green bars). The other ominous situation I am tracking is the relationship between the China and the U.S. markets. Both the China and U.S. markets declined steeply in 2008 and rebounded, but China’s market bottomed 5 months before the U.S. market. Now that China’s rebound appears to be over, could the U.S. market’s rebound also end soon?
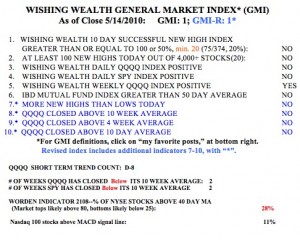
To answer that question, I rely on my GMI and GMI-R, which are both registering one point. We are in the middle of a short term down-trend in the QQQQ and I am in cash, fully hedged, or short in my trading IRA. The one remaining positive indicator is my longer term, Weekly QQQQ Index. If that should turn negative, making the GMI and GMI-R register zero, I will consider moving my university pension funds from mutual funds to money market funds. I typically, however, like to see a Stage 4 down-trend begin before I do that.  Meanwhile, we are in the 8th day of the current short term QQQQ decline (D-8). Since the inception of this decline (D-1), the QQQQ has fallen -2.6%, and 90% of the Nasdaq100 component stocks and 81% of the S&P500 stocks have declined. So much for trying to find the few winners to go long with. My students know that to have an edge in trading one must trade with the market’s trend, not against it. The Worden T2108 Indicator is now at 28%, out of oversold territory, having rebounded from 15% last Friday. With options expiring this Friday, things could get very volatile. I am content to be mainly on the sidelines with a bias towards the short side…….