I am getting tired of listening to all of the pundits saying that the current decline resembles the 1974 bear or the 1987 bear markets. How about looking at some data! So, I used my TC2007 market price history database to compute how much the Dow Jones Industrial average declined in prior bear markets after the market’s peak.
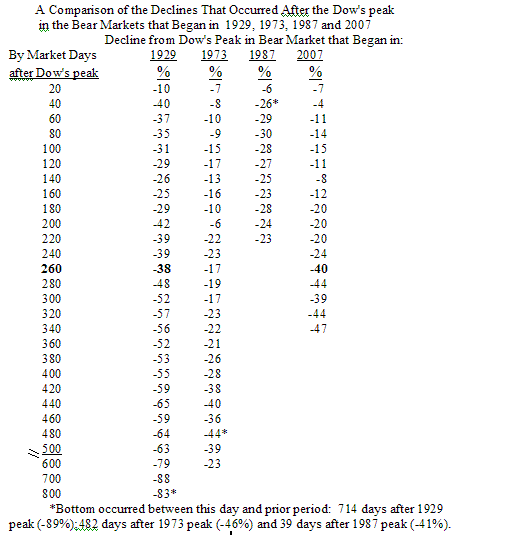
The results, presented in the table below, are quite revealing and unsettling if one is looking for a near term bottom. I would be interested to learn if you agree with my analysis.
Twenty days after the Dow had peaked, the Dow was down 7-10% in each of these beginning bear markets. By 40 days post Dow peak, the 1987 decline had already bottomed out (-41% by day 39) and rebounded to -26%. The ferocity of the 1929 bear was evident early on, showing a 40% decline by day 40. In comparison, the 1973 and 2007 bears appear puny, registering only 4% to 8% declines by day 40. The 1973 and 2007 bears tracked each other quite closely until 260 days post the Dow peak. By day 260, the 2007 bear was actually showing a greater than the decline that started in 1929 (-40% vs. -38%) and was more than twice the decline shown in the 1973 bear market (-17%). Since day 260, the current bear market has resembled the 1929 bear market closely, with declines being about 14 percentage points smaller. I would conclude then, that the current bear market is tracking much closer to the one that began in 1929 than to the 1973 and 1987 bears.
What can this tell us about the likely duration and depth of the current decline? First, if the current market decline resembles more the one that began in 1929 than in 1973, we would suspect that the current decline will last longer than the 1973 decline of 482 days and somewhat nearer the duration of the 1929 bear of 714 days. We are currently 342 market days post Dow peak, by my count. This suggests to me that the current decline could last another 370+ market days or about 74 more calendar weeks. In addition, if the current decline continues to track about 14 percentage points below the 1929 bear, its bottom of -89%, implies that the Dow could ultimately reach a bottom that is down about 75% below the Dow’s peak of 14,198.10 or about 3550.
Finally, it is likely that all market declines are driven by the economic context as well as investor psychology. So, note that major breaks during the 1973 and 1929 bears occurred around 420-440 days after the Dow’s peak. This could imply that a major psychological reaction (disgust? fear?) occurs around this stage of a decline and that the current market decline could accelerate at that time, about 4 months from now.
Of course, my interpretations are all based on the idea that the current bear will continue to track the 1929 bear. One cannot be too sure of how bears will behave though–ask any California state park trooper. Regardless, I think I am now more likely to pull back my horns and stay in cash or in a short position. It looks to me like this decline will continue at least as long as the 1973 bear–unless it doesn’t.

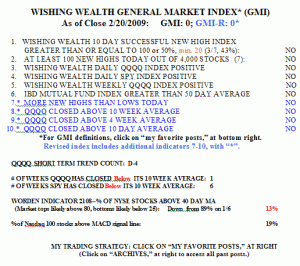
The GMI (0 to 6) and GMI-R (0 to 10) remain at zero. There were 7 new highs and 718 new lows in my universe of 4,000 stocks on Friday. This was the most new lows since late November 21st (1835) at the bottom of that decline. The Worden T2108 Indicator is at 13%, in what used to be bottom territory. My General Market Indicators (GMI) have helped me to steer clear of market declines since 1995. It is absolutely astonishing to me that the financial establishment continues to urge people to stay invested. I guess it is because brokers and mutual fund managers make no fees if their customers just sit in cash.
Anyway, as this table shows my GMI indicators continue to be in a terrible state. The last time I saw at least 100 daily new highs in my universe of 4,000 stocks was on September 19, and since then the few stocks that hit new highs rarely were trading higher 10 days later. Thus, buying growth stocks at break-out highs has been a losers game. This method, made famous by Nicolas Darvas on his way to making 2 million dollars in two years, just does not work when the general market is declining.
Why is it that when most stocks are declining, most people look for stocks to buy? Falling stocks fall for a reason, and most stocks are falling these days. It is so easy to make money buying stocks in a rising market when the GMI is greater than 3! As for now, the best thing for me to do is to be short or in cash. The way to make big money in investing is to be out of the market during the worst times.
I think most telling is that recent earnings have dropped more that stock prices. Markets bottom at low PEs.
http://www.investopedia.com/articles/technical/04/020404.asp
http://online.wsj.com/mdc/public/page/2_3021-peyield.html?mod=topnav_2_3000
Good post, Eric. We’ve been tossing around a possible Dow 3000 since the November lows. Here’s what Richard Russell has to say:
‘On last Friday’s site I brought up the matter of the 50% Principle. When Dow 7470 was violated, the 50% Principle turned bearish, which is another fact which is both discouraging and hard to swallow. With the 50% Principle, the Dow is now technically able to test the low from which the huge bull market of 1982 to 2007 began — that low was 776.’
In my opinion yu are right to compare the severity of this decline to ’29, but maybe is to be considered the different approach to the market of today’s times. In 1929 they have no idea of what on line trading could be, so this could develope moves and countermoves very faster and “complete the game” in a shorter time.
James, you sound bearish but that first link seems to be quite old and suggests that a P/E of 10 would be attractive, and the second link has the S&P at 10.5x. Sounds promising to me.
Eric, first of all I love the blog and the principles of your style. Absolutely one has to be patient in the decline. But in this case I think the comparison is proved to be unhelpful. I’m surprised it seems to lead you to be dismisssive of T2108 which seems to have a better record of tracking swings.
Japan 1991.
Fundamentally the same. Governmentally the same. Analogically the same. The chart swings are even similar.
Only thing that is different is that this collapse is globally synchronized; more along the lines of the 1930’s.
But Dr. Wish! You are a professor, a student of science. May I criticize and say, you don’t have enough data points (3 cases) to come to a statistically reasonable conclusion. Even adding Japan 1990’s, and 2000-2003 bear market, we still have only a handful. Add all the minor bear markets, and we still have a random roll of the dice.
Isn’t it enough just to take it day by day, and wait for the GMI and other market risk indicators to show us the light? 🙂
Colleagues: interesting comparison, but the past is not the key to the future nor the present! Today’s dynamics in the stock market are completely different. La-ti-daaa!
The primary determining factor in recovery of economies is
1. the amount of wealth disparity among the population when the depressions starts and
2. how quickly a regulatory/policy adjustment happens to allow the majority of the population to regain spending power. (2. will happen faster becuase a policy shifting election just took place. If McCain had been reelected likely it would have been delayed four more years unless he was really a tax the rich liberal running under the Republican umbrella which is very doubtful.)
Some market dips are psychological and those factors don’t matter but this one is clearly driven by the fundamental lack of spending power of the population.
the disparity of income is what allow ed those who predicted this collapse to predict it.
The disparity matches or is worse than 1929.
However there is another factor tha tis worse than 1929 and that is that much of the population not only has little wealth – they actually have NEGATIVE wealth becuase of the loose debt – so their hole to recover from to return to a spending consumer is larger unless debt forgiveness becomes government policy.
One can calculate what the dow should be base don estimates of sale the companies could have based on the spendable income of the current consumer’s actual monthly spending power and then applying reasonable PE ratios to those estimated corporate sale and combining them for a DOW. (I won’t tell you what me numbers say their becuase I sell that info for big money.)
however it is safe to say that their are few consumers in the USA with ANY spendable money now (most or in debt holes) and so they will only spend for essentials which now only include food, water, temperature control – significantly housing mortgages are dropped from that list – that’s how low the monthly consumer spendable income is.
In a nutshell though the bottom is that number.
That market bottom number changes if debt forgiveness is announced as public policy (which it has to be becuase most debts aren’t even being serviced so without forgiveness the consumer NEVER gets back to spending in the economy.)
the only other thing besides debt forgiveness that instantly change the market bottom number overnight are increases in the minimum wage which instantly increases consumer spending the month it goes into effect.
Lastly (but not in importance or effect) government spending increases the market bottom however you must apply a higher PE ratio to companies sales based on government spending becuase if the consumer wealth problem isn’t solved the government spending isn’t sustainable for more than a few years therefore you can’t value the stock permanently based on that short term increase in sales from government spending. (there is one exception to that – if the government increases it’s taxes on those who can pay now then government CAN sustain that spending.)
WATSON: Good points. That’s why the current administration will have to increase tax on the wealthy, and decrease tax on middle class. Also, it seems you don’t believe in the “tricle-down theory”!
What now?