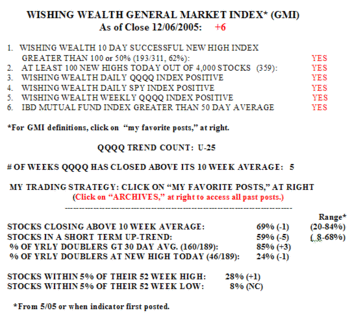
The GMI is still at +6. However, some of my other indicators are down from their recent peaks reached last Friday, including the percentage of stocks in a short term up-trend (59%, down from 65%) and those above their 10 week averages (69%, down from 73%).  There were 359 new highs on Tuesday, the highest since July 20. The fact that the market closed off the highs of the day is troubling, but not enough to change the current outlook. Tuesday was the 25th day of the current up-trend. Between 53%-63% of the Nasdaq 100, S&P 500 and Dow 30 stocks advanced on Tuesday. Check out my discussion of JNJ as a sick stock posted on Saturday if you missed it. It’s all in the chart!
NOTE: A NEW SECTION TO THE BOTTOM RIGHT PROVIDES LINKS TO MY FAVORITE PRIOR POSTS. THESE INCLUDE MY STRATEGY POSTS, DEFINITIONS OF THE GMI COMPONENTS, AND MY ANALYSIS OF WHY THE TRADING TECHNIQUES OF THE GREAT NICOLAS DARVAS WORK BEST DURING BULL MARKETS AT ALL-TIME HIGHS.
How have you used this site to inform your trading? Can you send me some experiences I can post for others (anonymously, with your prior permission)? Please send your pearls of Wishdom to me at: silentknight@wishingwealthblog.com.