The markets continued to weaken on Thursday, but the GMI remains at 5. The GMI-S, however, fell 19, to 44. None of my four short term indicators for the QQQQ remain positive. 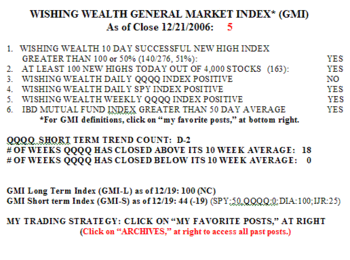 Only 28% of the Nasdaq 100 stocks advanced on Thursday, along with 32% of the S&P 500 stocks and 20% of the Dow 30 stocks. Only 28% of the IBD 100 list from 12/18 rose and only 28 closed above their close when the list was published. Growth stocks are clearly hurting. There were 163 new 52 week highs in my universe of 4,000 stocks. Only 42% of the Nasdaq 100 stocks have now closed above their 30 day averages, the lowest since last August 9, during the market decline. Many of my indicators are the weakest they have been since the decline last summer. In view of the developing down-trend in the QQQQ, I am slowly accumulating the ultra inverse QQQQ ETF, QID, which goes up as the QQQQ falls. This is the first time my IRA can make a good profit from a market decline without the need to purchase put options on individual stocks or indexes. The QID is leveraged so that it will rise twice as fast as the QQQQ declines.
Put Options
GMI: 6; IBD 100 stocks not outperforming: MACD bearish divergence; HANS has had it?
The GMI is still at the maximum of 6 and the trend remains up. 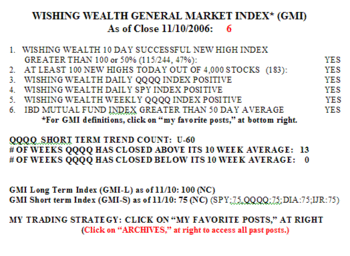 67% of the Nasdaq 100 stocks rose on Friday, along with 68% of the S&P 500 and 53% of the Dow 30 stocks. There were 115 successful 10 day new highs (stocks that hit a new high 10 days ago that closed higher on Friday than 10 days ago) and 183 new highs in my universe of 4,000 stocks. Friday was the 60th day in the current QQQQ up-trend and that index has closed above its 10 week average for 13 consecutive weeks. The only serious cloud on the horizon, partially reflected in the GMI-S reading of 75, is that the MACD statistics of the QQQQ, DIA ans SPY ETF’s have failed to hit new highs with their indexes. This bearish divergence is a troubling sign and I am ready to move quickly if the GMI should weaken.
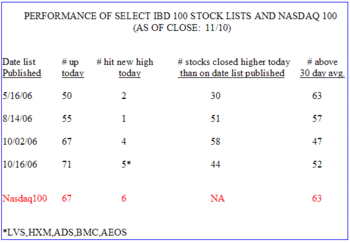
The IBD 100 stocks have been doing about as well as the Nasdaq 100 stocks recently. Note, however, that only 44% of the stocks on the list published on 10/16 closed higher on Friday than they did of the day the list was published. Only 5 of those stocks hit a new high on Friday.
As you know, I do not fight the market trend. However, I think we should watch a real juicy short developing. After rising for three years, I think HANS looks like it is about to roll over. Take a look at this weekly chart. After months where the 10 week average (dotted line) was above its 30 week average (red line), the 10 week average is now below the 30 week which is curving down. At the bottom you can see the big red spikes representing high volume selling. I wonder when the bad news will come out. If I were inclined to fight the general market trend, I would be buying put options on HANS in my IRA…….. 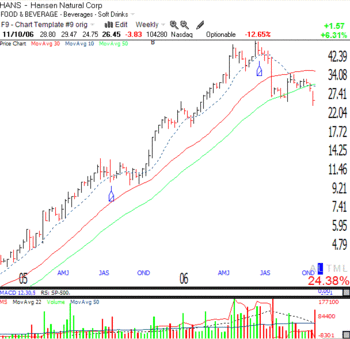
GMI: 6; put/call ratio bullish?
The GMI is still at a maximum of 6. There were 364 new yearly highs in my universe of 4,000 stocks. 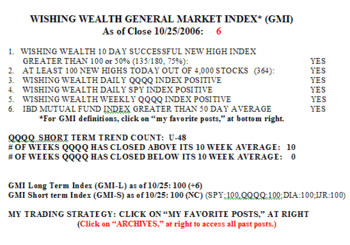 63% of the Nasdaq 100 stocks advanced on Wednesday, along with 58% of the S&P 500 and 70% of the Dow 30 stocks. 58% of the IBD 100 list stocks from 10/16 rose and 14 of these stocks hit a new high. Wednesday was the 48th day in the current QQQQ up-trend.
One of the reasons I was confident of a continued rise in the QQQQ is that the put/call ratio on Tuesday was a high .97. This means that 97 puts were traded for each 100 calls. Put options are bets on a stock’s decline while call options are bets on a rise. Option traders tend to be wrong at the extremes. A put/call ratio near 1.00 is a high reading and often correlated with a rise in the market. When many people bet on a decline, the market often rises. It is noteworthy that when this market shows any sign of weakness, many people bet on a further decline. Skepticism of the market’s rise tends to be bullish. You can find the put/call ratio each day in IBD in a small chart inside the S&P 500 chart on the General Market page…….
