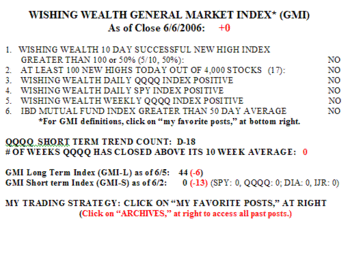
Another losing day with the GMI firmly stuck at zero.  There were only 17 new highs and 136 new lows in my universe of 4,000 stocks. The longer term moving averages are now starting to weaken. The GMI-L fell to 44 and the GMI-S is now at zero. The extreme weakness in the short term indicators is now spreading to the longer term indicators. If this weakness in the longer term indicators continues we may find the markets in a significant down trend……………..
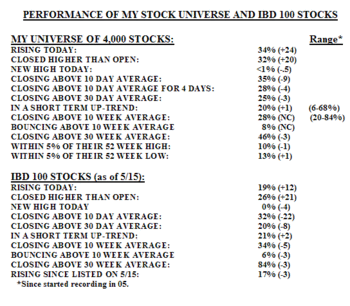
The IBD 100 stocks have been decimated and are underperforming my larger universe of almost 4,000 stocks.  34% of the stocks in my universe rose on Tuesday, compared with 19% of the IBD 100 stocks. There were zero new highs in the IBD 100 stocks and <1% in my universe of stocks. More stocks in my universe closed above their 10 day averages (35% vs. 32%) and their 30 day averages (25% vs. 20%). Note that the wide majority of both groups of stocks have closed below their average closing prices of the last 10 and 30 days. Only about one fifth of both groups of stocks are in a short term up-trend. Furthermore, more stocks in my universe are within 5% of a new low (13%) than a new high (10%). The IBD 100 stocks still have the edge in closing above their longer term 10 week and 30 week averages, but the gap has narrowed for the 10 week average (34% vs. 28%). Of most significance, only 17% of the IBD 100 stocks published in the list on 5/15 closed higher on Tuesday than they closed on 5/15, compared with 32% of my universe of stocks…
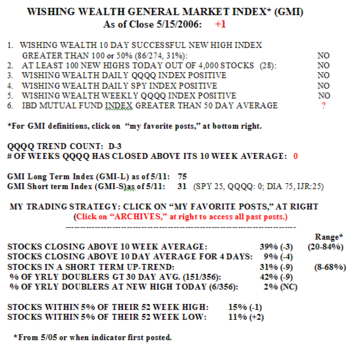
When the premier IBD 100 growth stocks cannot hold up, the market is in a lot of trouble. I hope that most of my readers went to cash or short when the GMI fell to +1 on 5/14. Using the GMI indicators, I have avoided all significant market declines since 1995. It is now time for me to wait on the sidelines, mainly in cash until the GMI strengthens. I do own some put options in my IRA which have appreciated nicely during this decline. I highly recommend O’Neil’s brief book on selling short……
Please send your comments to: silentknight@wishingwealthblog.com.

