If anyone tells me they know when a market decline will end, I ignore them and run the other way. The truth is that no one knows, except by chance, when a market will turn. The market consists of millions of “voters” all betting on stocks using different strategies and each with their own tolerance for risk. In comparison, predicting political election returns appears easy! Trend followers are always late. We get out after the market turns down and back in after it starts up. If we can trade consistent with the general market’s trend, we have a small advantage to enable us to profit from trading. Technical analysis gives us an edge over the others who are the equivalent of travelers in unfamiliar territory without the aid of a map or a GPS. So we watch for signs that have in the past signaled a change in trend and have worked for us.
So what do I look at for signs of a change in the market’s trend? (I have lived through many market cycles since I started trading around 1964.)
1. Stage analysis a la Stan Weinstein. Stage analysis has been the major strategy that I used to get me out of the market in 2000 and 2008 and back in after the market turned. We are still in a Stage 2 up-trend in the DIA, SPY and QQQ. However, the SPY and DIA have now closed below their critical 30 week averages for the first time in over a year. The QQQ may follow them below its 30 week average in the coming week. If they remain below these averages and the averages turn down, the market could be at the beginning of a major Stage 4 decline. I will look for that and if it occurs, will transfer my pension money out of mutual funds and into money market funds in stages. My more nimble trading accounts are already in cash.
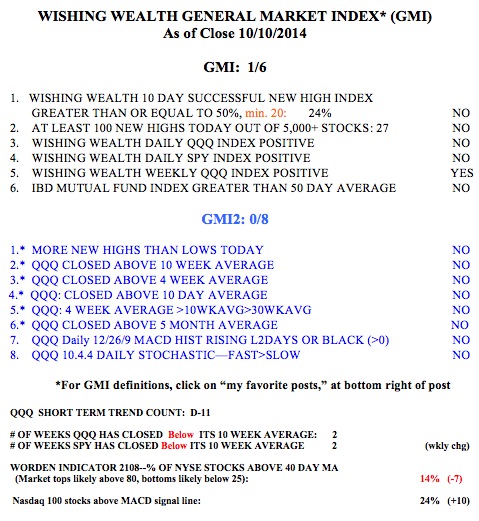
2. GMI My GMI flashed a Sell signal in late September and that is when I started to move into cash in my trading accounts. The GMI measures 6 indicators that have helped me to stay on the right side of the market over the years. If the GMI goes to “0” we will be that much closer to a Stage 4 decline. The GMI is typically on a “Buy” signal for so long, that it makes sense to me to be long in the market only during those times. Why fight the market trend? So I will look to go long individual stocks again when the GMI closes above 3 (of 6) for two consecutive days= Buy signal.
3. The Worden T2108 acts as a pendulum of market extremes. It measures the percentage of all NYSE stocks that closed above their simple average price over the past 40 days. When T2108 is above 80% that is usually as good as it gets and I look for a decline or leveling off in the market. When T2108 gets to single digits, a rare event, it reflects a deeply oversold market and I should be looking to get back in only via a general market index ETF, like SPY. The market always comes back, but not all individual stocks do. So it is a good idea for me to buy a small amount of SPY and to add to it if the bottom holds. The T2108 closed Friday at 14%. In 2013, the lowest it reached was 13%. During a relatively large decline in 2011 it reached 7%. When T2108 gets into single digits the business news is quite bad. At that time I must fight my emotions and “fly on instruments” and make an initial small investment in the index ETF whiles I grit my teeth and hold my nose. The key is to start small and add only at higher prices if the bottom holds. Alternatively and much less stressful, I can just wait for the new Stage 2 advance to begin before I wade back in.
4. I watch the daily put/call ratio. When it gets close to 1.2, the market at least bounces. A ratio of 1.2 means that 120 put options were traded for every 100 call options traded that day. This means that option traders are extremely bearish and the market usually confounds these people by moving up. Think of it as a “contrary” indicator, like most other investor sentiment measures. On Friday, IBD says the ratio reached 1.16.
5. IBD Market Pulse. I never made money trading until I started reading IBD in the 1980’s. IBD is the technical analyst’s newspaper. IBD publishes their market pulse in the paper every day. Their methodology is very good and in contrast to the other major business papers and establishment media, IBD will actually advise their readers to get out of the market. William O’Neil’s book (How to make money…) is listed to the right of this page and is literally a users manual for his newspaper, IBD. My university class has this book as required reading. IBD has called the market in a correction for almost as long as the GMI has been on its recent Sell signal. (We employ different technical strategies for assessing the market’s trend, yet we frequently agree.)
6. The final point I like to remember is that unless there are significant adverse tax consequences or mutual fund penalties from timing the market, there is no reason that I should not exit the market if I am uncomfortable. The media try to scare us into staying invested, perhaps because the amount of assets they manage for us usually determines the amount of management fees they take. They warn that if one gets out of the market, one will likely miss the bottom. The way I look at it is if I get out of a fund at price “X” and the value of my fund declines, as long as I get back in lower then X, I come out ahead. I therefore do not have to get back in at the exact bottom, and I get to sleep more soundly and watch from the sidelines as the decline continues……..