Markets are trying to make up their mind. I am invested a little in long positions and mainly in cash.
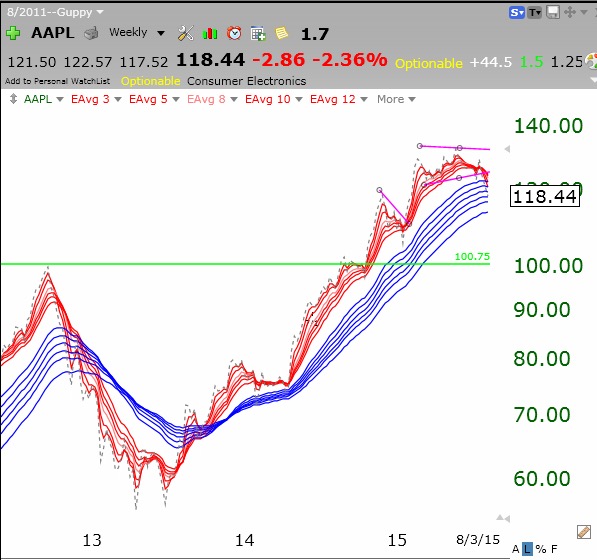
$AAPL falls off tree
AAPL has broken down.
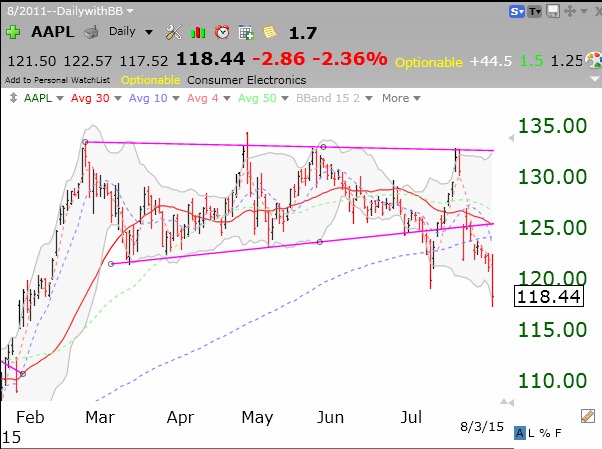 But the shorter term averages (red) are still above the longer term averages (blue).
Fly on instruments?
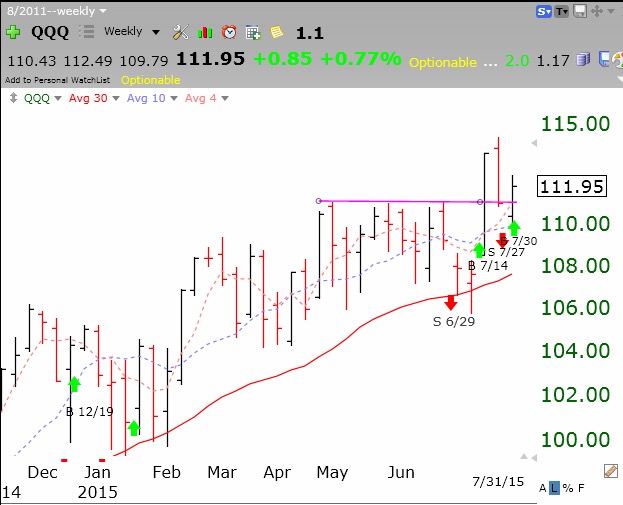
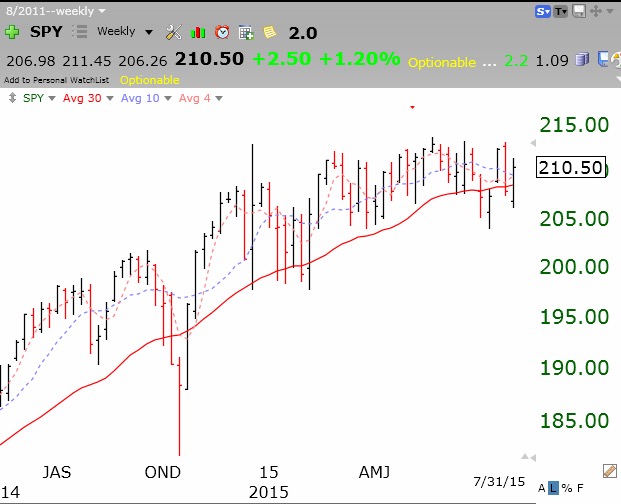
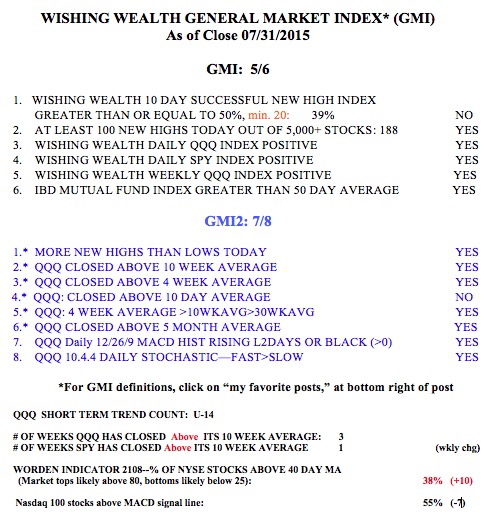
This is one of those times when my emotions tell me to flee but my instruments say buy or hold. The GMI has again flashed a Buy signal. My very short term trend count for the QQQ is U-14, 14th day of an up-trend. The SPY has retaken its 30 week average along with the QQQ. Only the DIA, weighted down by energy and large multinational stocks, remains below its 30 week average. AAPL remains below its 30 week average along with the majority of the Dow 30 stocks. However, the QQQ looks like it wants to go up. Both the QQQ and SPY have closed above their critical 30 week (solid red line) and 10 week averages (blue dotted line). These markets remain in up-trends…..