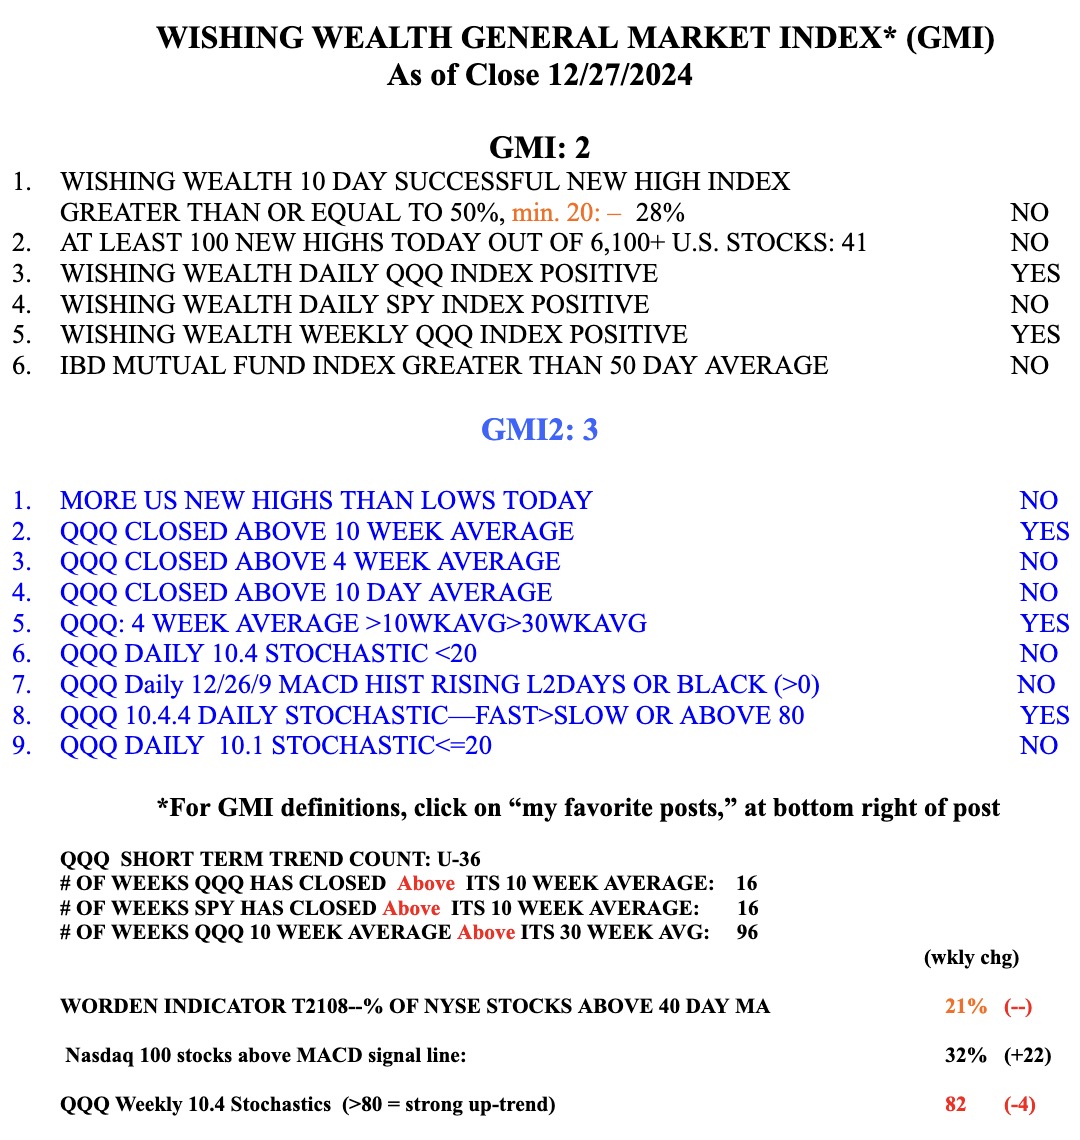
Blog Post: Day 1 of new $QQQ short term down-trend; But 10 growth stocks did reach an ATH, see list; Of note, $JPM reached an ATH last week but closed just below its green line peak of $172.96

GMI3/6
GMI-24/9
T210866%

Stocks on my recent IBD/MS watchlists, sorted by last column, close /close 250 days ago. KGS was a recent IPO in 6/23.

The GMI, at 3,  still signifies a longer term up-trend. However, within this up-trend, QQQ has begun a short term down-trend. About 40% of these short term down-trends end within 5 days. If QQQ’s short term down-trend persists I may gradually accumulate some SQQQ.

Blog Post: $QQQ short term up-trend could end Friday; Meanwhile, $QS rockets higher on battery test results. I don’t mean to plug it but the results are electrifying. See daily chart and how I found out about it.

GMI4/6
GMI-24/9
T210868%

More than a year ago, my stock buddy, Judy, told me about QS. Judy had researched the company and was excited about the solid-state battery they were developing. This morning she called me to say that QS was rocketing higher on news with enormous trading volume and that I should buy some. She also noted that QS had a high short interest ratio signifying that many speculators will need to rush to buy shares to cover their short positions. So I bought a little at $8.02. QS subsequently ran up today to $10.03. I am holding the shares long term because, according to the news, the company’s tests of their battery have exceeded expectations and it may eventually become a major breakthrough product for EVs. Apparently Volkswagen agrees  since it has a position in QS. Way to go Judy! (The blue and black dots on the chart are my oversold bounce indicators and the “N” means I wrote a note after the purchase.) As with all new products there is risk from other competitors and it will likely take a while for the battery to be ready for mass production.

Blog Post: Day 41 of $QQQ short term up-trend, GMI declines to 4 (of 6); After 9 straight weeks above, $QQQ is now below its 4 wk average, see weekly chart

GMI4/6
GMI-24/9
T210870%

A stong advance is evident when the 4wk>10wk>30 average and the stock continually climbs above the 4 wk average. It is clear from this chart that QQQ is now below the 4 wk average (red dotted line). If it closes the week below, it suggests to me that the recent up-trend is over for now. We now have to see whether it finds support at the 10 wk avg (blue dotted line). SPY and DIA show similar patterns. The longer term trend remains up as long as the index is rising above the climbing 30 wk avg (Stage 2). I am mainly in cash now in my trading IRA.