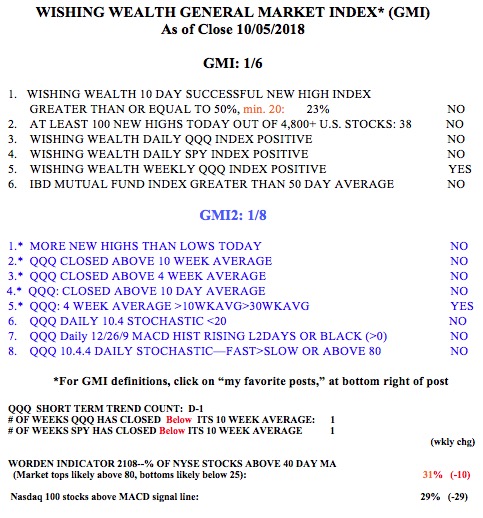
$QQQ daily RWB up-trend gone, safely in cash

GMI1/6
GMI-21/9
T210812%

The nice daily RWB up-trend is now over and could begin a significant BWR down-trend. No one knows how and when this decline will end. With the T2108 at 12, we are near levels where the market has typically bottomed. But in 1987 it reached <1%! Put/call ratio= 1.08, not high enough. When we get a ratio of 1.20 or higher the market will likely bounce, at least short term. No reason for me to return to the market until the QQQ closes (dotted line) back above all of the red line averages.

$XIV disaster; GMI flashes Red; $AAPL in daily BWR down-trend; wading into $SQQQ

GMI1/6
GMI-21/9
T210824%

The GMI has now flashed a Red signal. This is a sign for me to be extra cautious and in cash or short in my trading accounts. The QQQ short term down-trend is now 2 days old. I have a small position in SQQQ, the triple leveraged ETF that is designed to rise three times as much as the QQQ declines. On Wednesday, the QQQ fell -1.3% and SQQQ rose +3.8%. If the short term down-trend persists, I will add to my position in SQQQ. By definition, SQQQ moves quickly up and down.

Contributing to the weakness in QQQ, AAPL is now in a daily BWR down-trend with all of its shorter averages (red lines) below declining longer term averages (blue lines).

The debacle in the ETN, XIV, may be behind some of the selling in stocks by hedge funds to raise cash. Check out its weekly chart and learn why ETNs can be much more risky than ETFs–a 95% weekly decline!


New $QQQ short term down-trend; Daily RWB patterns gone

GMI2/6
GMI-21/9
T210823%

The GMI could turn Red on Wednesday and Tuesday began a new QQQ short term down-trend. Many short term down-trends have ended in less than 5 days. If this one can get to 5, I may accumulate some SQQQ. Furthermore, the market may have to retest Tuesday’s lows. The daily 10.4 stochastics of the major indexes did get to levels where bottoms have occurred. The put/call ratio is now 1.01. For now, I see no reason to step off the sidelines and enter this market. Cash is king!

This daily chart shows that the SPY no longer has an RWB pattern. The SPY needs to close (dotted line) above all of the red lines (shorter averages) to suggest a new up-trend. 

Same goes for the QQQ.