Stock Market Technical Indicators & Analysis
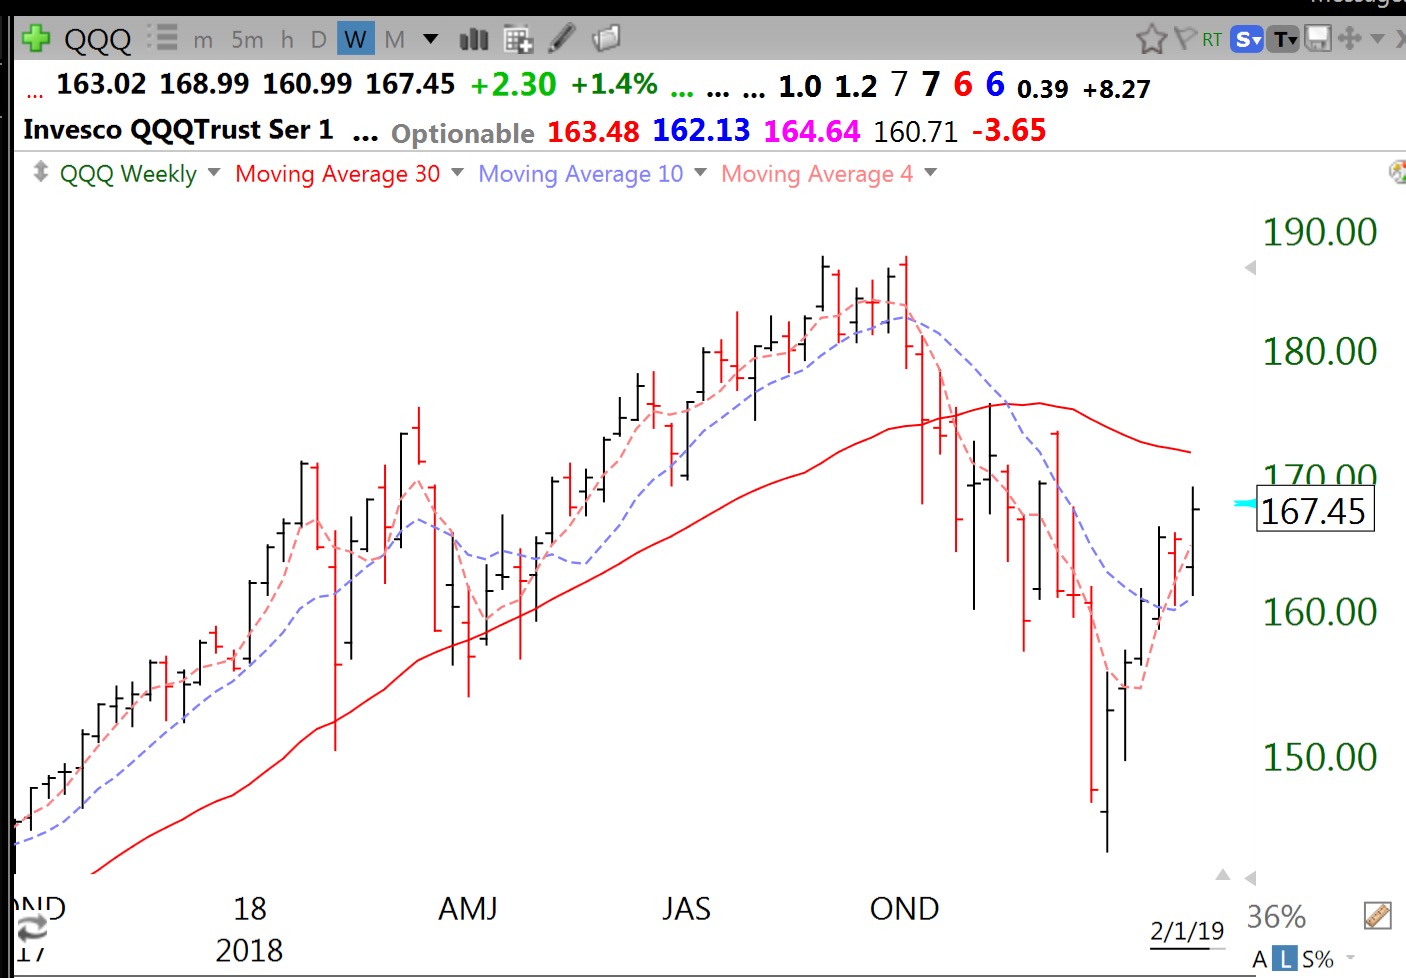
This weekly chart of the QQQ shows clearly that this index (as well as the DIA and SPY) is still below its declining 30 week average (red line). This is a Stage IV decline. The index has made a nice rebound from the December lows. If the index can close back above the 30 week average and if the red line turns up, it will be time for me to be 100% back in the market. Until then, I take small positions in a few strong stocks and set close stop losses. One note of caution. T2108 is at 84% an extremely overbought level it rarely reaches or remains at.
The GMI, at 5 (of 6) is now on a Green signal.
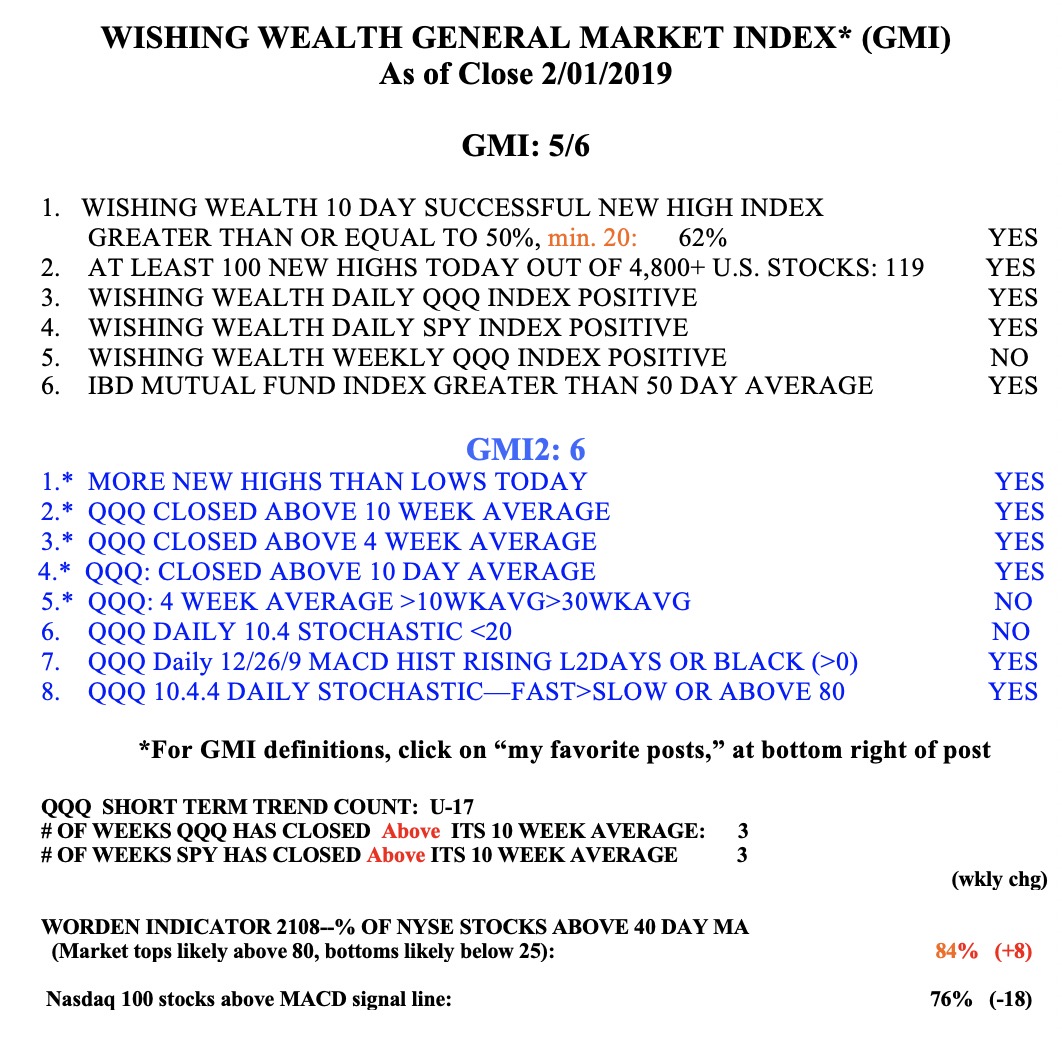
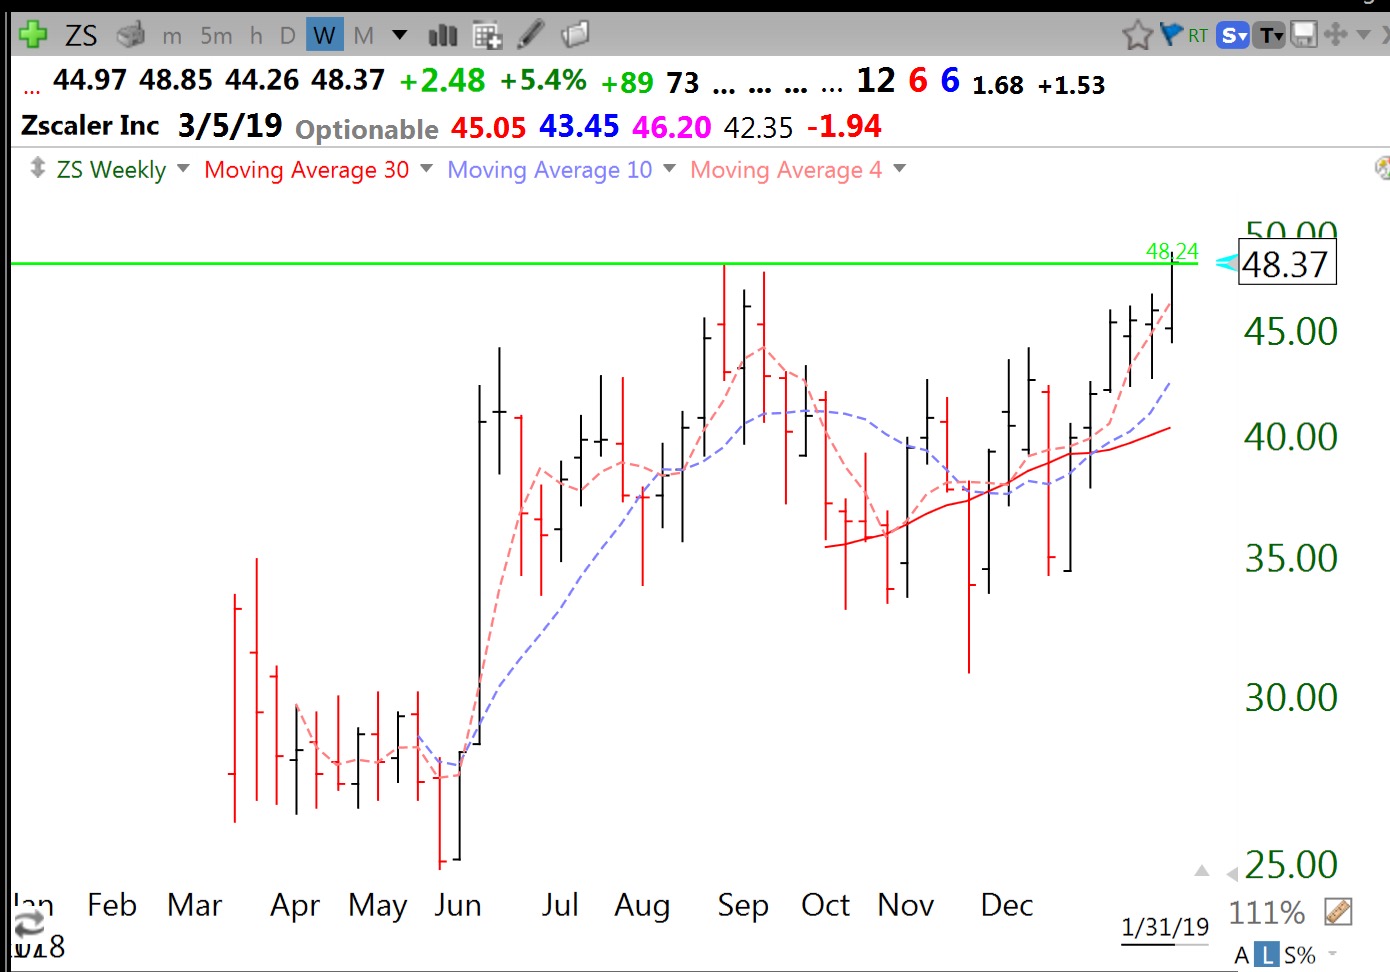
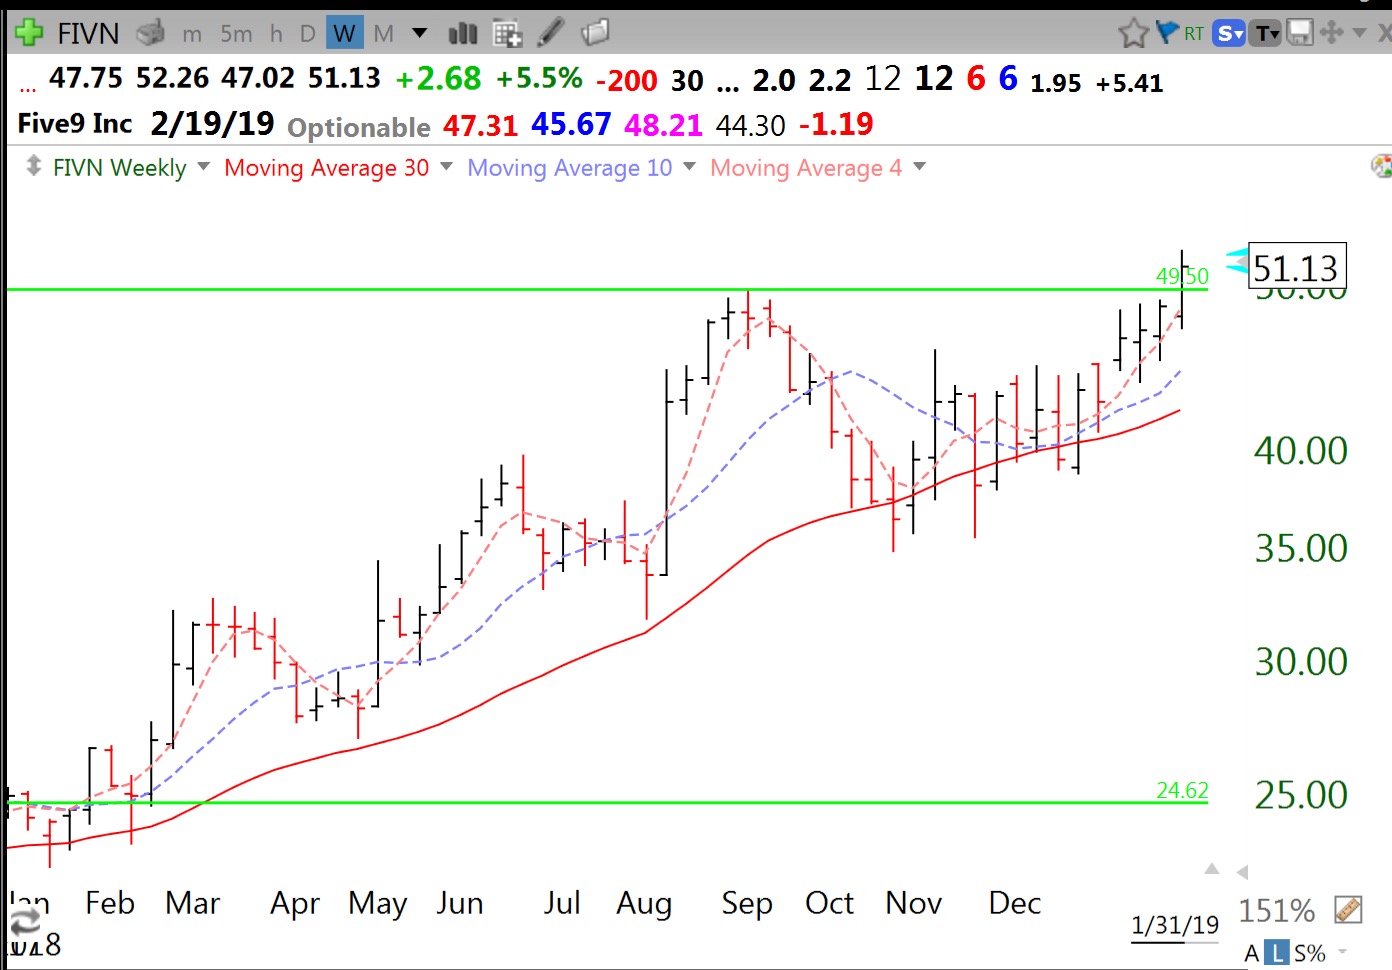
With the GMI now above 3 for 2 consecutive days, the signal is now Green and I will look for GLB (green line break-out, see glossary) stocks to purchase. I will be more confident, however, when the final GMI component turns positive. The GMI is now 5 (of 6). TC2000 alerted me to 2 GLB stocks yesterday, ZS and FIVN. Here are their weekly charts.