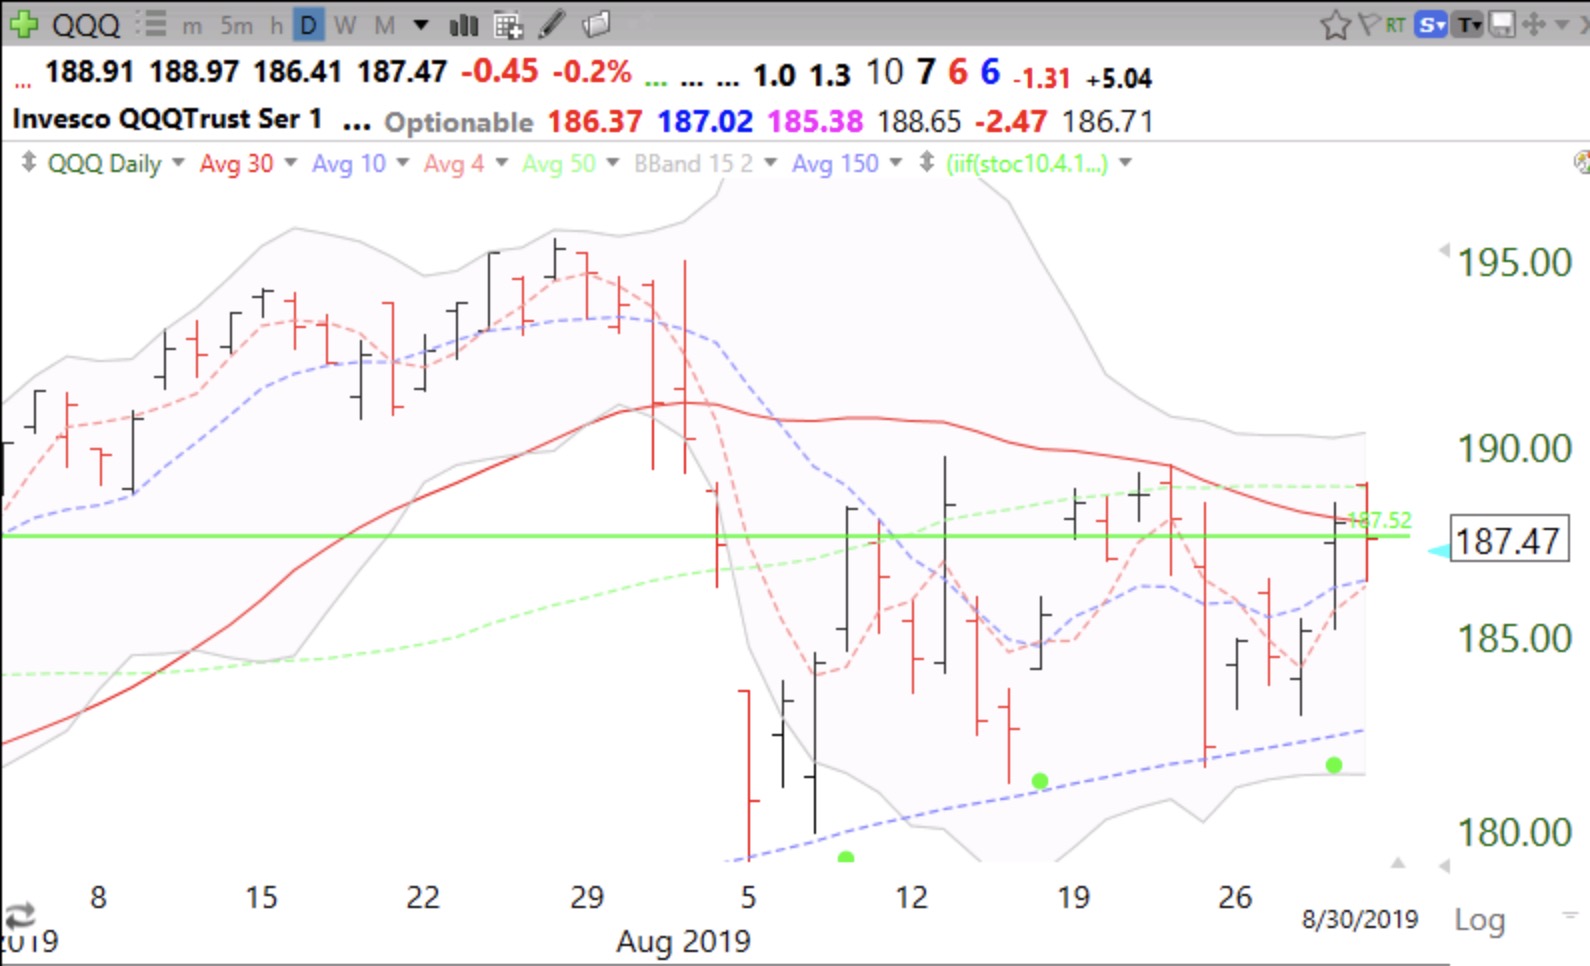
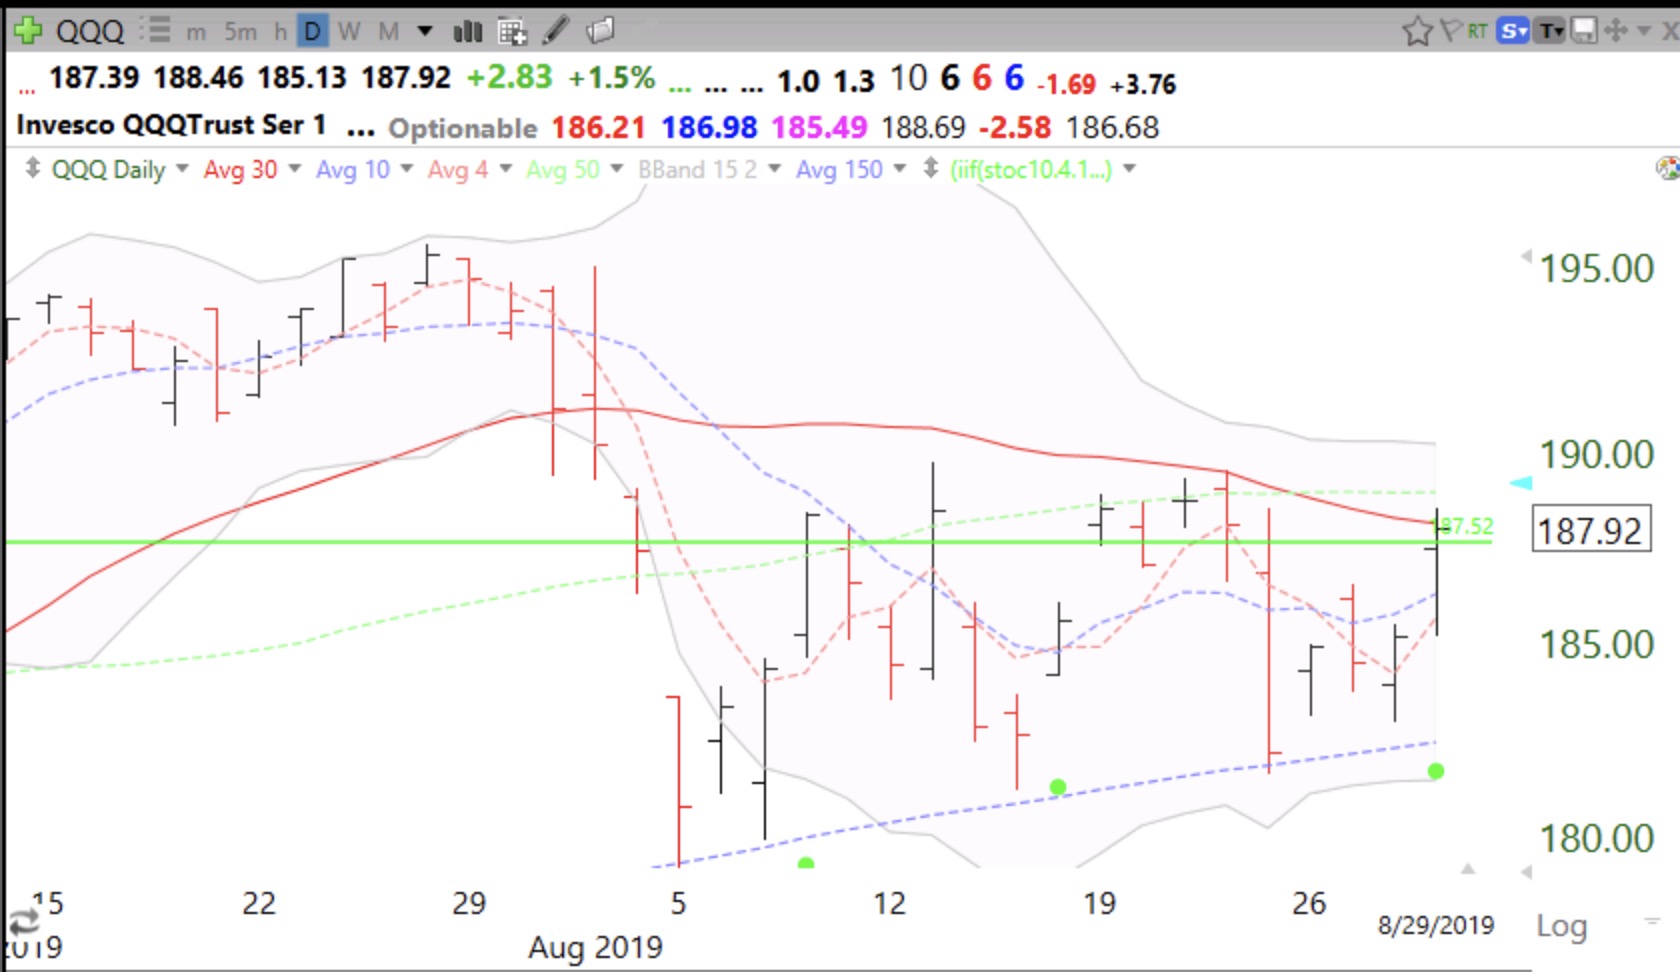
KL hit an all-time high on Tuesday and has a terrific weekly RWB pattern. KL has tripled since having a green line break-out (GLB) in June 2017. This chart shows a recent break-out from a 3 month base.
Stock Market Technical Indicators & Analysis
KL hit an all-time high on Tuesday and has a terrific weekly RWB pattern. KL has tripled since having a green line break-out (GLB) in June 2017. This chart shows a recent break-out from a 3 month base.
Of 38 world ETFs in my watchlist, none have RWB daily and weekly patterns (see blog glossary). Only 7 of the Nasdaq 100 stocks and 19 of the S&P500 stocks and 1 of the Dow 30 (PG) do so. There were 1004 new lows and 10 new highs on Monday out of 4900+ U.S. stocks. Best to be short or in cash now. As is often the case, in tough times people turn to gold. GLD is now in a daily RWB up-trend.
In 2000 and 2008 I went to cash in all of my accounts and avoided the market carnage. The major signal that I followed was the curving down of the 30 week moving average of the QQQ. This time I have been in cash earlier because I am more conservative as I approach retirement. I know its seems counterintuitive, but the QQQ now appears to be entering a Weinstein Stage IV decline. If this is true, the down-trend is just beginning. The only thing to get me back into this market on the long side would be if the indexes can close back above their 30 week averages and the averages begin to rise. This strategy has worked great for me.
On Friday there were 21 new highs and 763 new lows in my US stock universe of over 4900 stocks. With odds like that, why try to buy stocks at new highs hoping that they continue higher? ? The best tactic of late has been shorting stocks that are trading at new lows.
All 6 of my GMI and 8 of my GMI2 indicators are negative.