I was planning to write a post about the virtue of trading expensive stocks and then I discovered that I had done so in 2018. My 2018 post explained why I liked to buy stock stocks trading over $100. I noted that Jesse Livermore had said he was interested in number of points gained, not the percentage gained. It took me a while to appreciate his logic. I now find more success trading stocks over $200.
Stocks that can rise to $200 have attracted considerable buying and allow me more flexibility to control the trade. I therefore have added a filter to my scans for oversold bounces that now requires a current price >$ 200. If my timing is right and the stock begins to rise after being oversold, I can be looking at a possible triple digit move. Most large point moves occur in stocks already in triple digits, see my 2018 post.
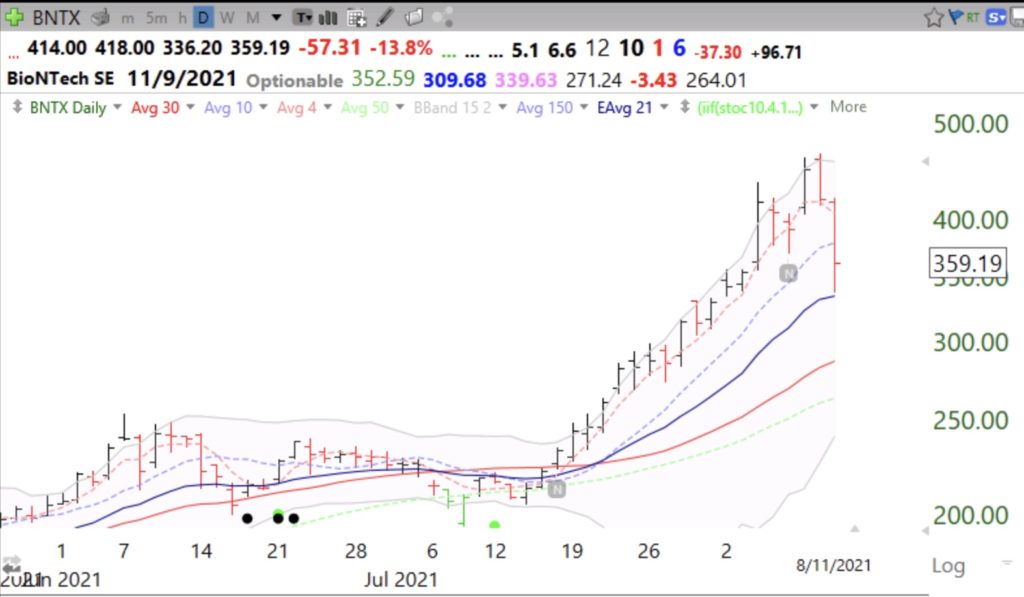
For example, look at the daily chart of BNTX. On July 16, (designated by the first N) my scan showed BNTX to be bouncing from oversold while it was around $231. BNTX then rose to over $430. That 200 point rise gave me a lot of space to pyramid into the stock and to control my risk. The VCP pattern prior to the break-out also encouraged me to buy.
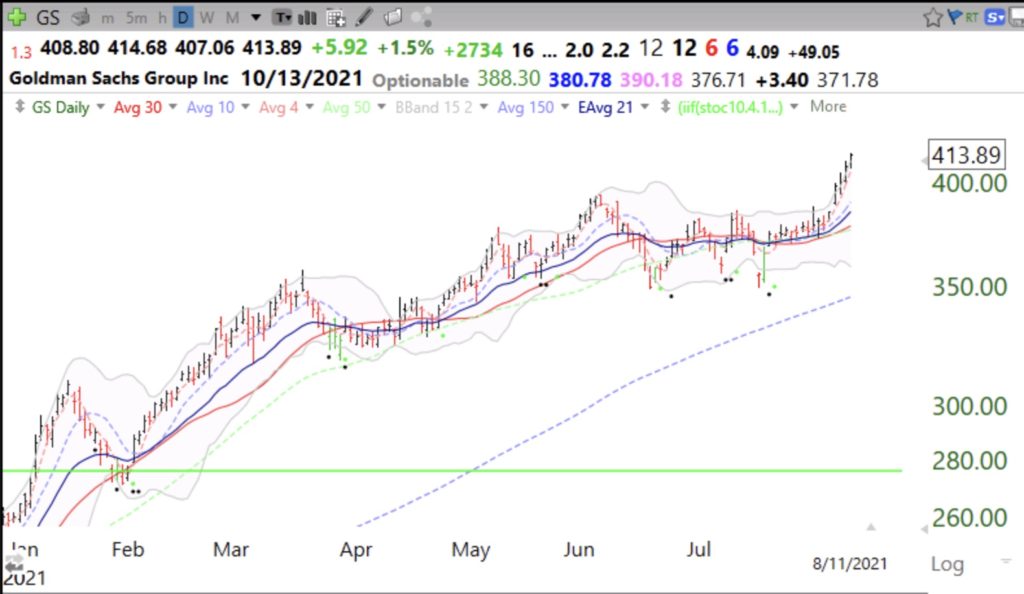
Another example is GS. After retesting its GLB (green line break-out to ATH) in February, at around $275, GS rose into the $400s.
Note the many green and black dot buy signals throughout the move.
