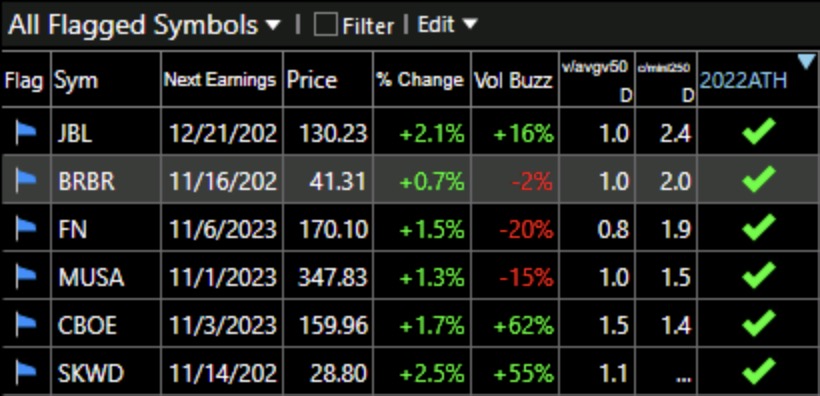
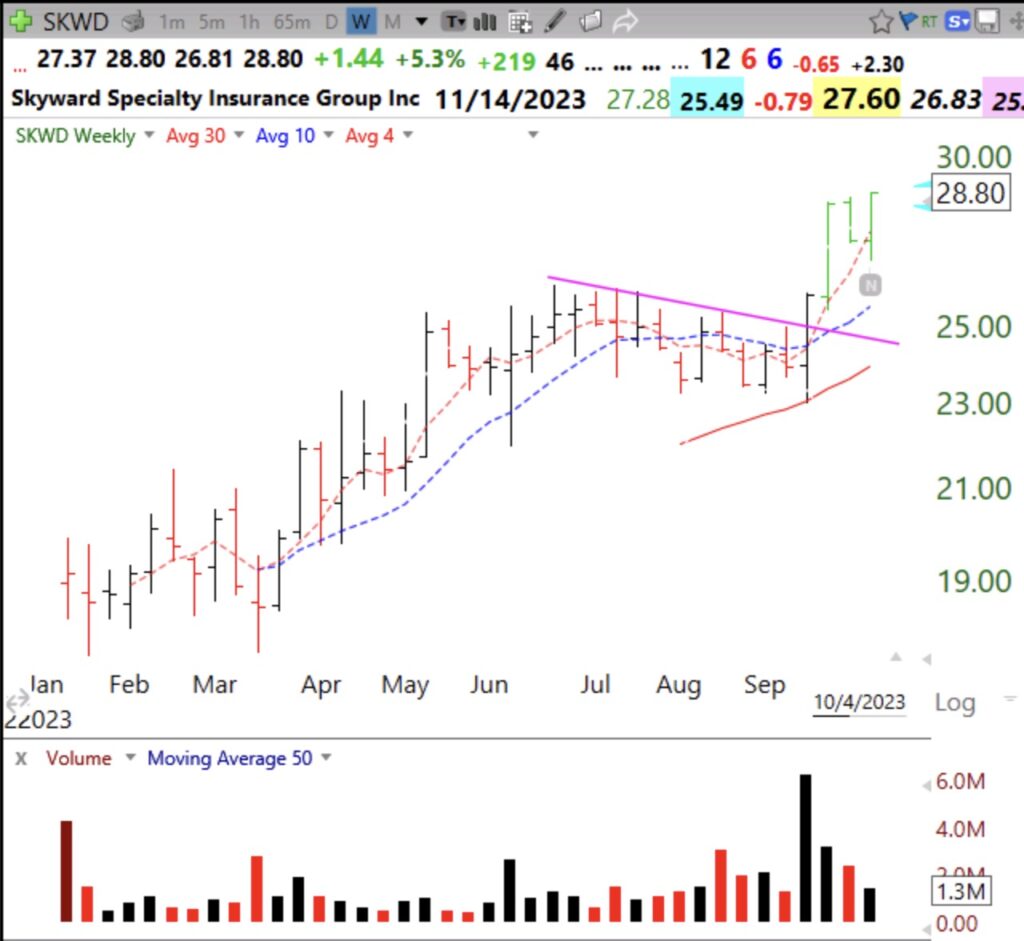
The unusually high put/call ratio, the low T2108 value, plus the fact that earnings are coming next week suggest to me that we are about to experience a meaningful bounce. 89% of the Nasdaq 100 stocks rose on Wednesday, the highest percentage since August 29 (91%). These 6 stocks on my IBD/MS recent watchlist hit an ATH on Wednesday. They are sorted by price/lowest price last 250 days. SKWD has no value (…) because it is a recent IPO. See its promising weekly chart below.
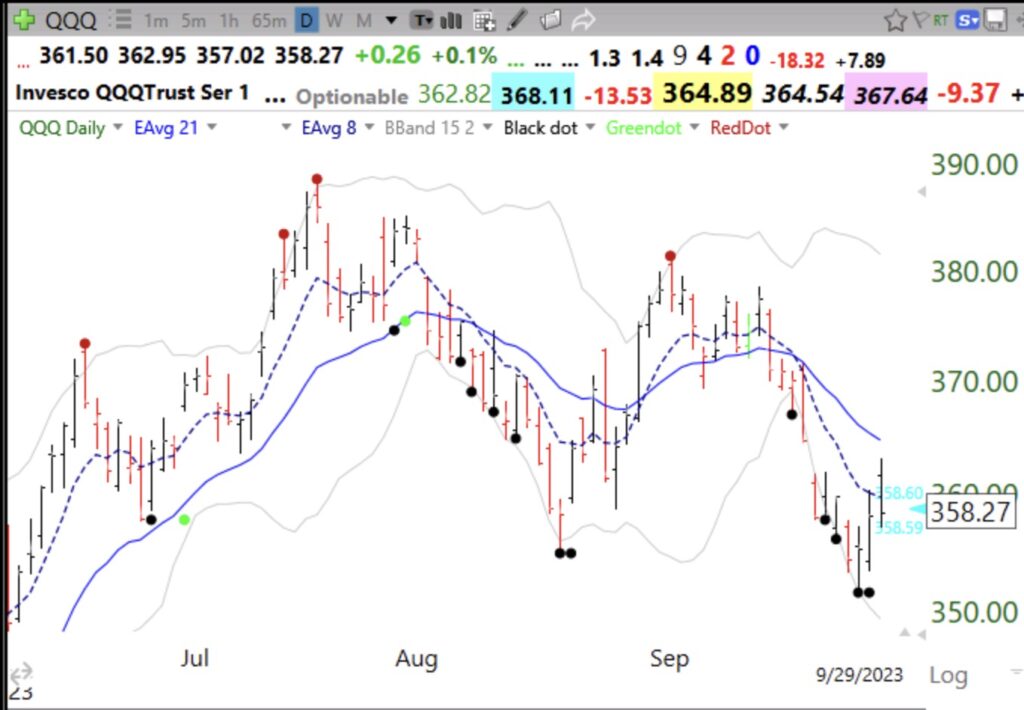
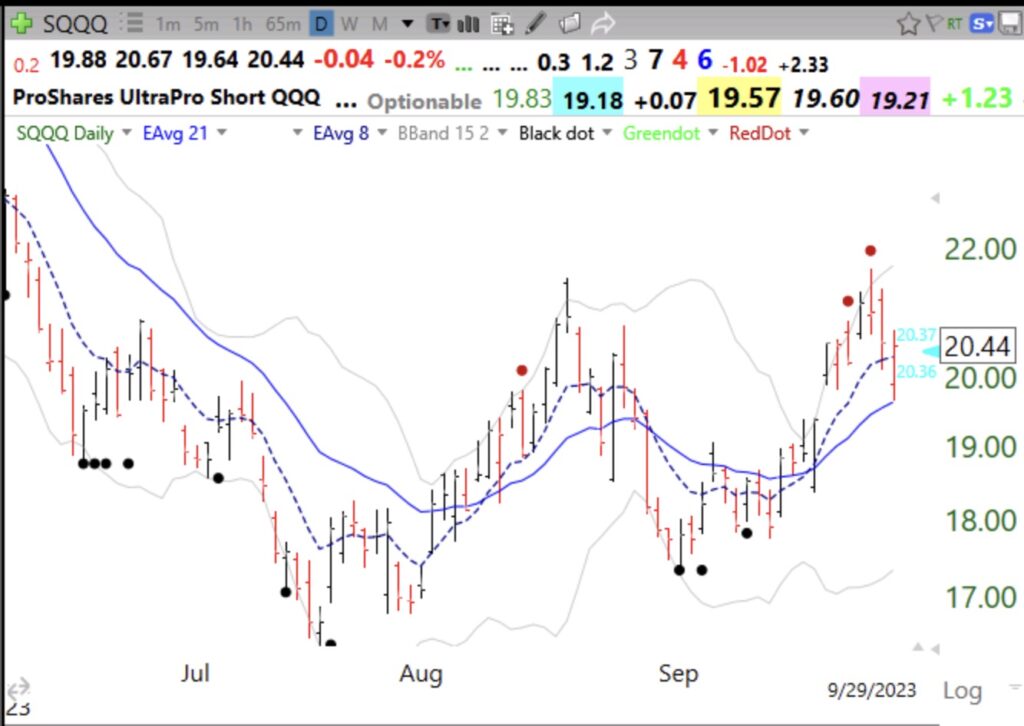
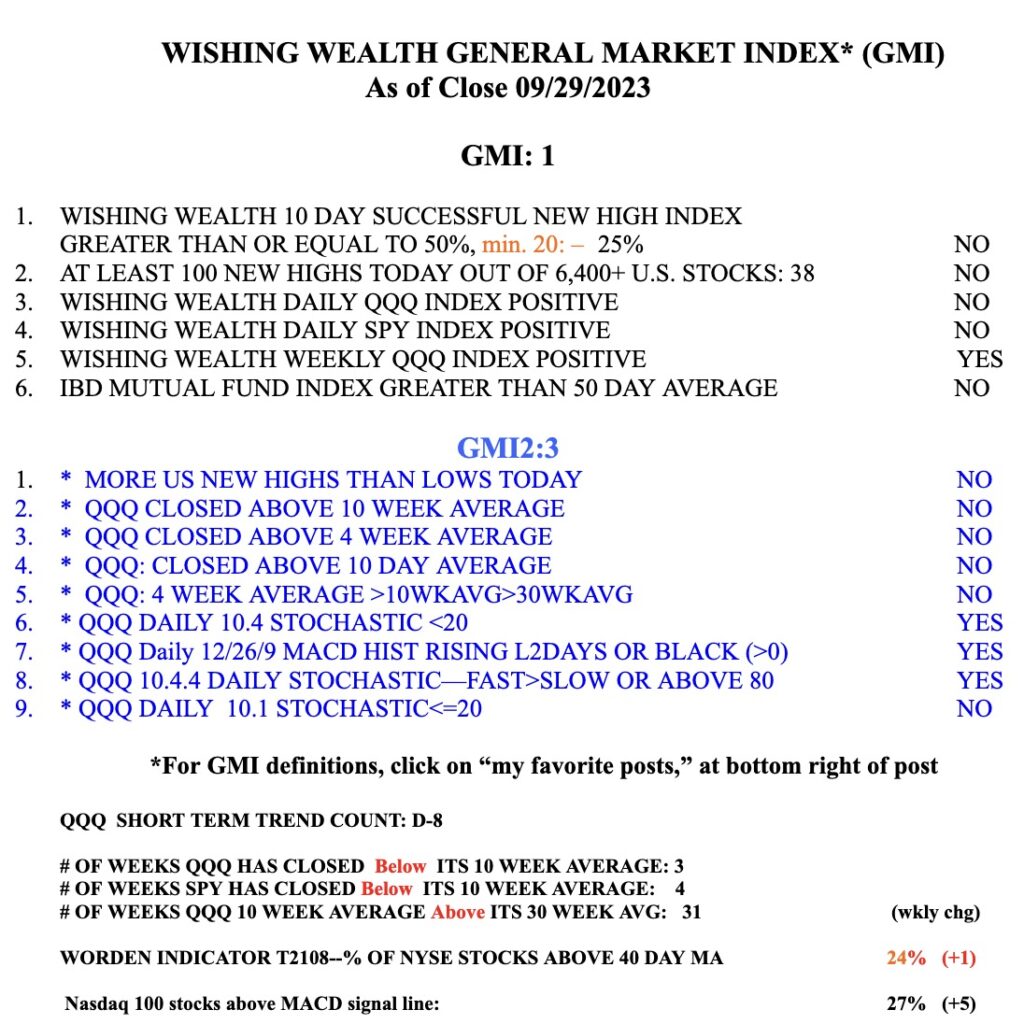
Blog Post: Day 8 of $QQQ short term down-trend; 38 new US highs and 65 lows; $QQQ remains in a longer term Stage 2 up-trend, but not $DIA and maybe not $SPY; With GMI=1 and Red, it is time to be very defensive and maybe in a little $SQQQ, see daily charts of QQQ and SQQQ, but will last week’s bounce hold?
QQQ remains in a short term down-trend. One way to play this is to own a little SQQQ, a 3x leveraged bearish ETF, that rises when QQQ falls. But we need to be nimble because many down markets have ended in October. As the Sell in May saying says, return on Halloween. Let’s see first if last week’s bounce holds. It may present an opportunity to get into SQQQ a little lower.
