I am going to share with you a strategy that has helped me to make money the past year. It conflicts with most of the truisms that we have been taught about the market. But if we trade like most people do, than we can expect to have the results most have— to not make money. One has to pursue one’s own ideas to be successful trading.
So, first note that the title to this post involves finding stocks that will appreciate $25 in a month, and not a percentage increase. I have been told by many, and it is mathematically true, that a rise from $5 to $10 is the same percentage increase as a stock that goes from $50 to $100. But psychologically, I find it easier to trade a stock that is rising $50 on the way to a double, than a stock that must go up $5 to double. In other words, it is not the percentage move that I am after, it is the number of points in the rise.
Let’s assume for this discussion that the typical stock that breaks out of a base goes up 20% before it consolidates or reverses. A 20% move in a $10 stock is only $2, but it is $20 in a $100 stock. I have more time (at least psychologically) and courage to add to a position in a stock that is rising for $20 than to one that is only on the way to a $2 rise.
So I want to hop on board a stock that is breaking from a base or support and that is likely to advance $20+ if I am right. How do I find such stocks? Well, I used TC2000 to look at all stocks that advanced $25 or more in the past 30 days. I found 21 stocks as of Friday. The most consistent characteristic of these stocks was that 90% (19/21) were priced at $80 or more 30 days ago; 17 were greater than $100 per share. I have done this analysis before and it always comes out the same. Most stocks that rise $20 or $25 or more in the past 30 days were above $80 at the beginning of the period. During this period, GOOG rose +$101, AAPL +$61 and ISRG +$63.
So, if I want to ride a stock that will advance a lot of points, I should be looking at stocks that are already expensive, more than $80 per share. Other reasons I like expensive stocks is that the in and out high frequency day-traders are less likely to have the money to play with these stocks. And expensive stocks are there for a reason, people, mainly funds, are bidding them up.
So, trading expensive stocks may be a fine strategy, but many people, you say, cannot buy many shares of an $80+ stock. This is true, but the missing ingredient is deep in the money (DITM) call options. I use DITM call options to buy expensive stocks for 10%-20% of the cost of the stock. What I do is to find an expensive stock that I think is bouncing off of support or breaking out. Once I find one, I look for a near month call option that has 3-6 weeks before expiration and which will cost me under 20% of the price of buying the stock.
This example should illustrate the strategy. If I believe that NFLX, which closed Friday at $276.58, is in an up-trend and bouncing off of support, I go to yahoo.com and look up the August call options. I find that the August 230 call can be bought for about $49 per share, or $4900 (each option covers 100 shares). This option would give me the right, but not the obligation, to purchase 100 shares of NFLX at $230 each through August 19. Since I am paying $49 per share for the options, if I were to use the option to buy the shares, my cost or break even point is $279 (230+49), just about $2.50 above the current price of NFLX. (With a DITM option the break even price is close to the current price of the stock.) Once NFLX rises above $279, I make $100 per point, just as if I owned the 100 shares of stock. If NFLX rises $25 to around $301 per share before the option expires in August, my profit would be about $2200 (301-279 x 100). And I never have to buy the 100 shares of NFLX because I could now sell the option that I bought for $49 for the price of $71 (301-279).
So what we have manged to to with a DITM call option that cost $4900 is to control 100 shares of NFLX, which would have cost $27,658. In a sense, we only had to put down and risk about 18% of the price of the stock. I say risk, because it is accurate. If I bought the 100 shares of NFLX and it fell to zero, I could lose the entire cost, $27,658. But with a call option, the most I could lose is the $4900 that I paid for the option. If the stock is below the strike price, $230, at expiration, it expires worthless. But I would never wait for that to occur. If NFLX declines below support. I would just sell the option at the best price available at the time. For example, if on August 19, NFLX is trading around $270 per share, my option would trade for about $40 (270-230 strike). In other words, at expiration someone would use the option to buy 100 shares of NFLX at $230 and be able to sell the stock immediately in the market for the current price of around $270, a $40 per share profit.
So this all comes down to that, all other things being equal, if one wants to buy a stock with a better chance of appreciating many dollars during the next month, it is preferable to buy a very expensive stock by using DITM call options. Chapter 7 of Jim Cramer’s latest book, Getting Back to Even, gives some examples of the uses of DITM call options. I assign Michael Sincere’s book, Understanding Options, to my students who want an options primer…….
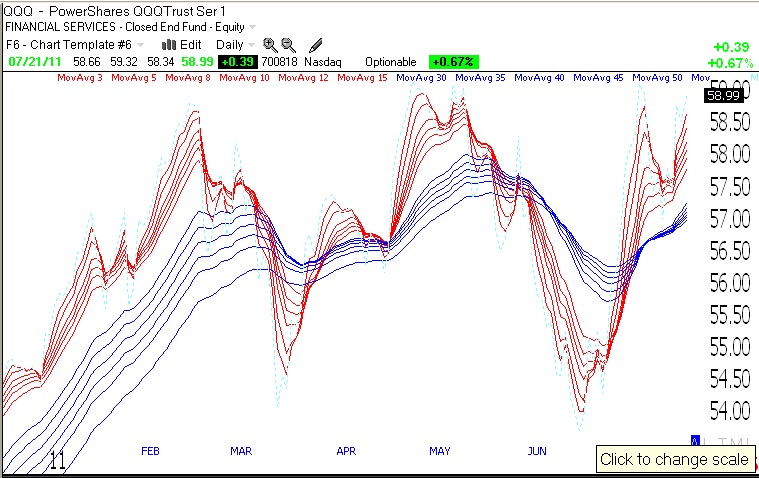
The GMI closed the week at 5 and the GMI2 at 6. So I am comfortable being long. 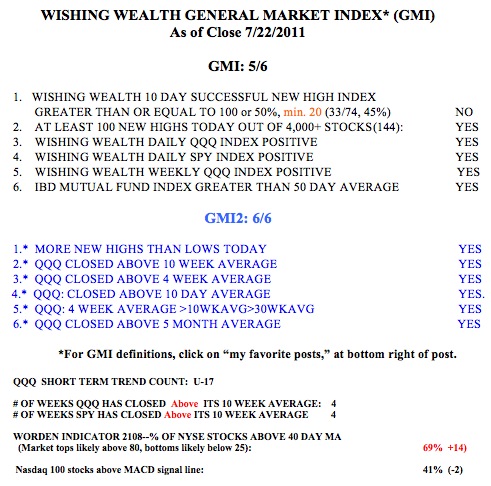 It looks like the money is rotating into tech stocks again, so I own QLD as a way of riding this trend. QLD is a leveraged ETH that aims to rise or fall each day twice as much as the QQQ, or Nasdaq 100 index. Once the short term trend changes, I slowly accumulate QLD (for up-trends) or QID (for down-trends). On Friday the QQQ completed its 17th day of the short term up-trend. The QQQ and SPY have now closed above their critical 10 week averages for 4 weeks.
I try to trade consistent with the market’s direction, and to ignore all other factors, including the news and politics. The market has a mind of its own and I msut trade in synch with it.