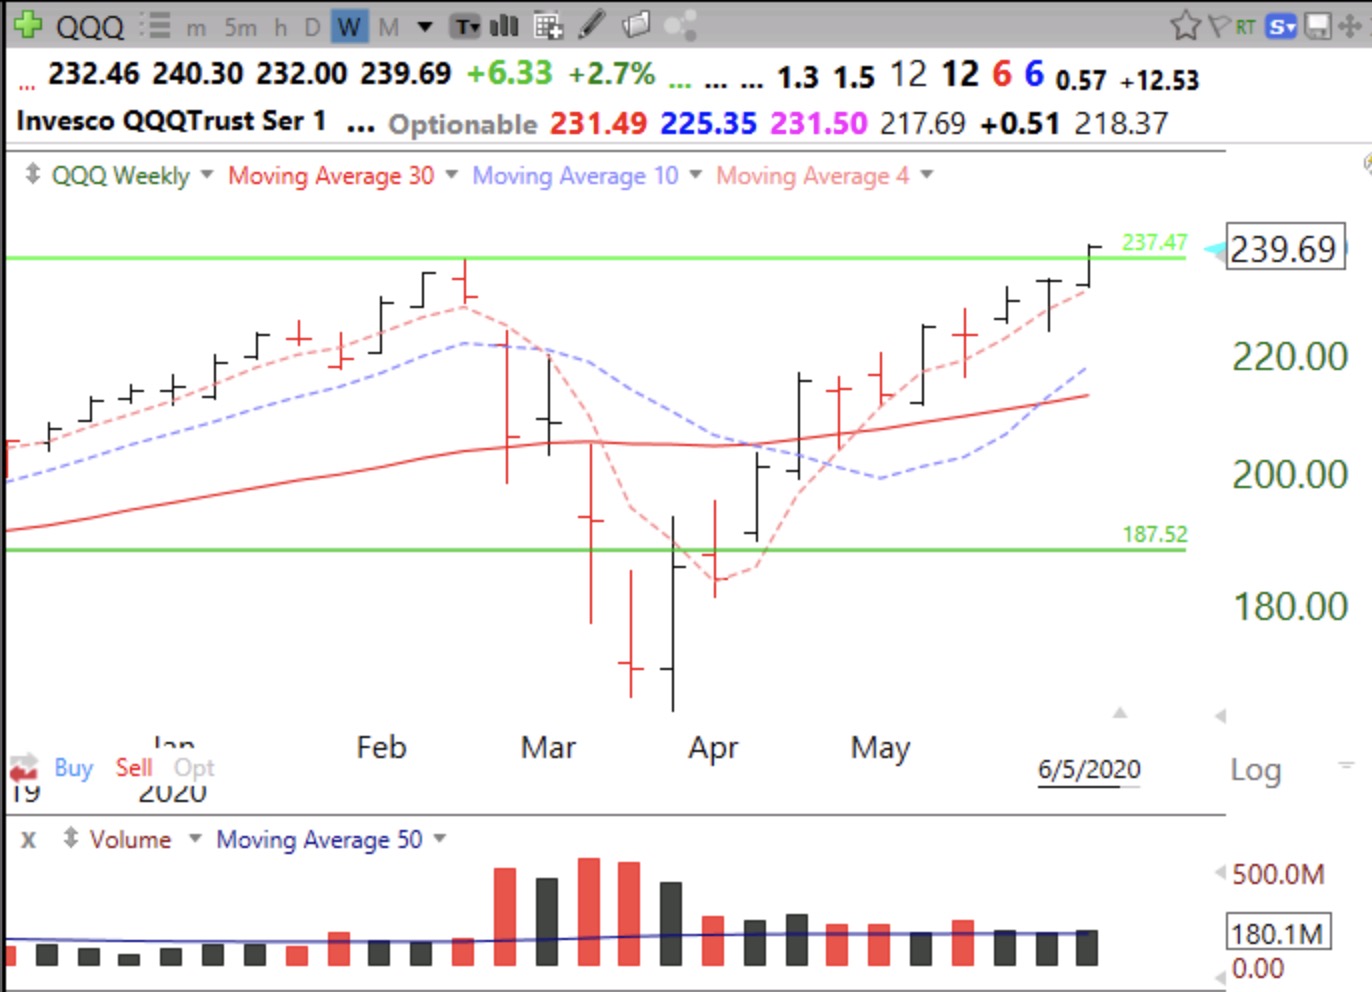
Note that the QQQ closed the week right on its 4 week average (pink dotted line) and on the precipice. There is no reason to be brave here with the futures predicting a swoon at the open. Failure to hold the GLB was a serious sign of technical weakness and could be a double top. Went to cash in my trading account and hold some SQQQ.
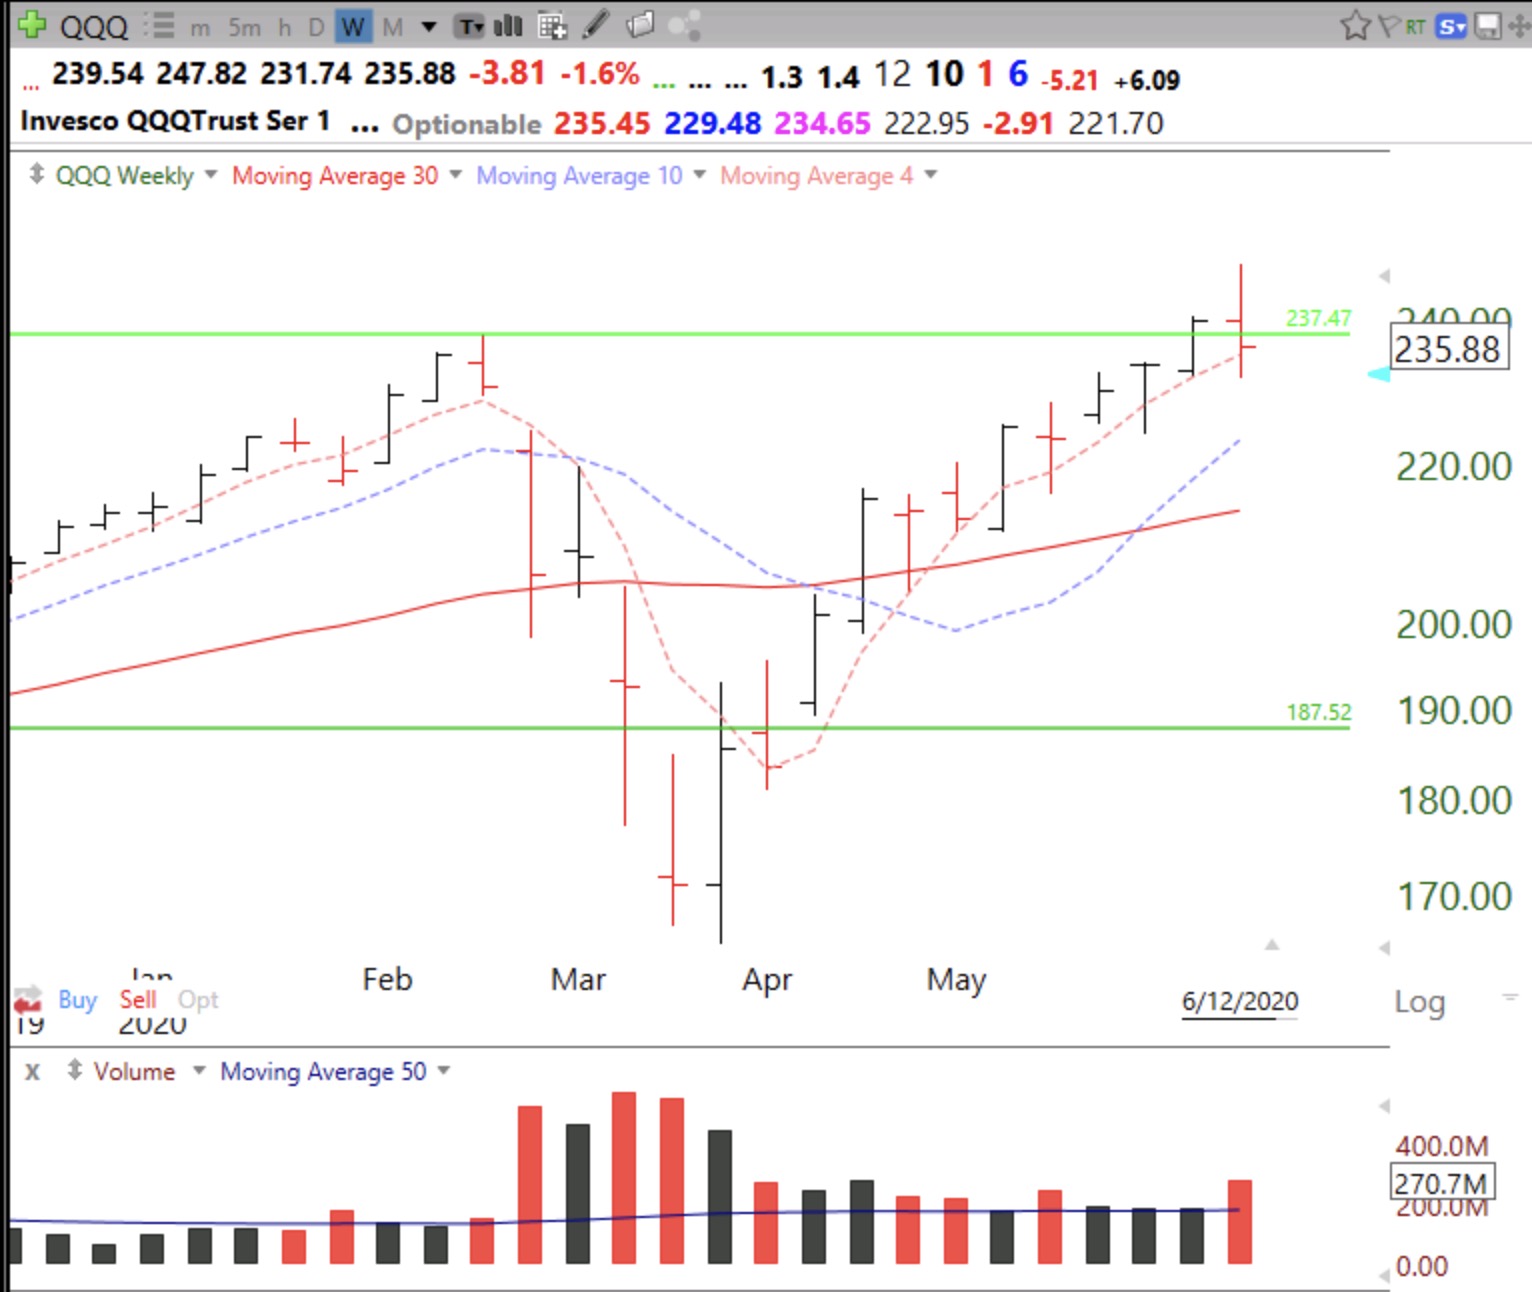
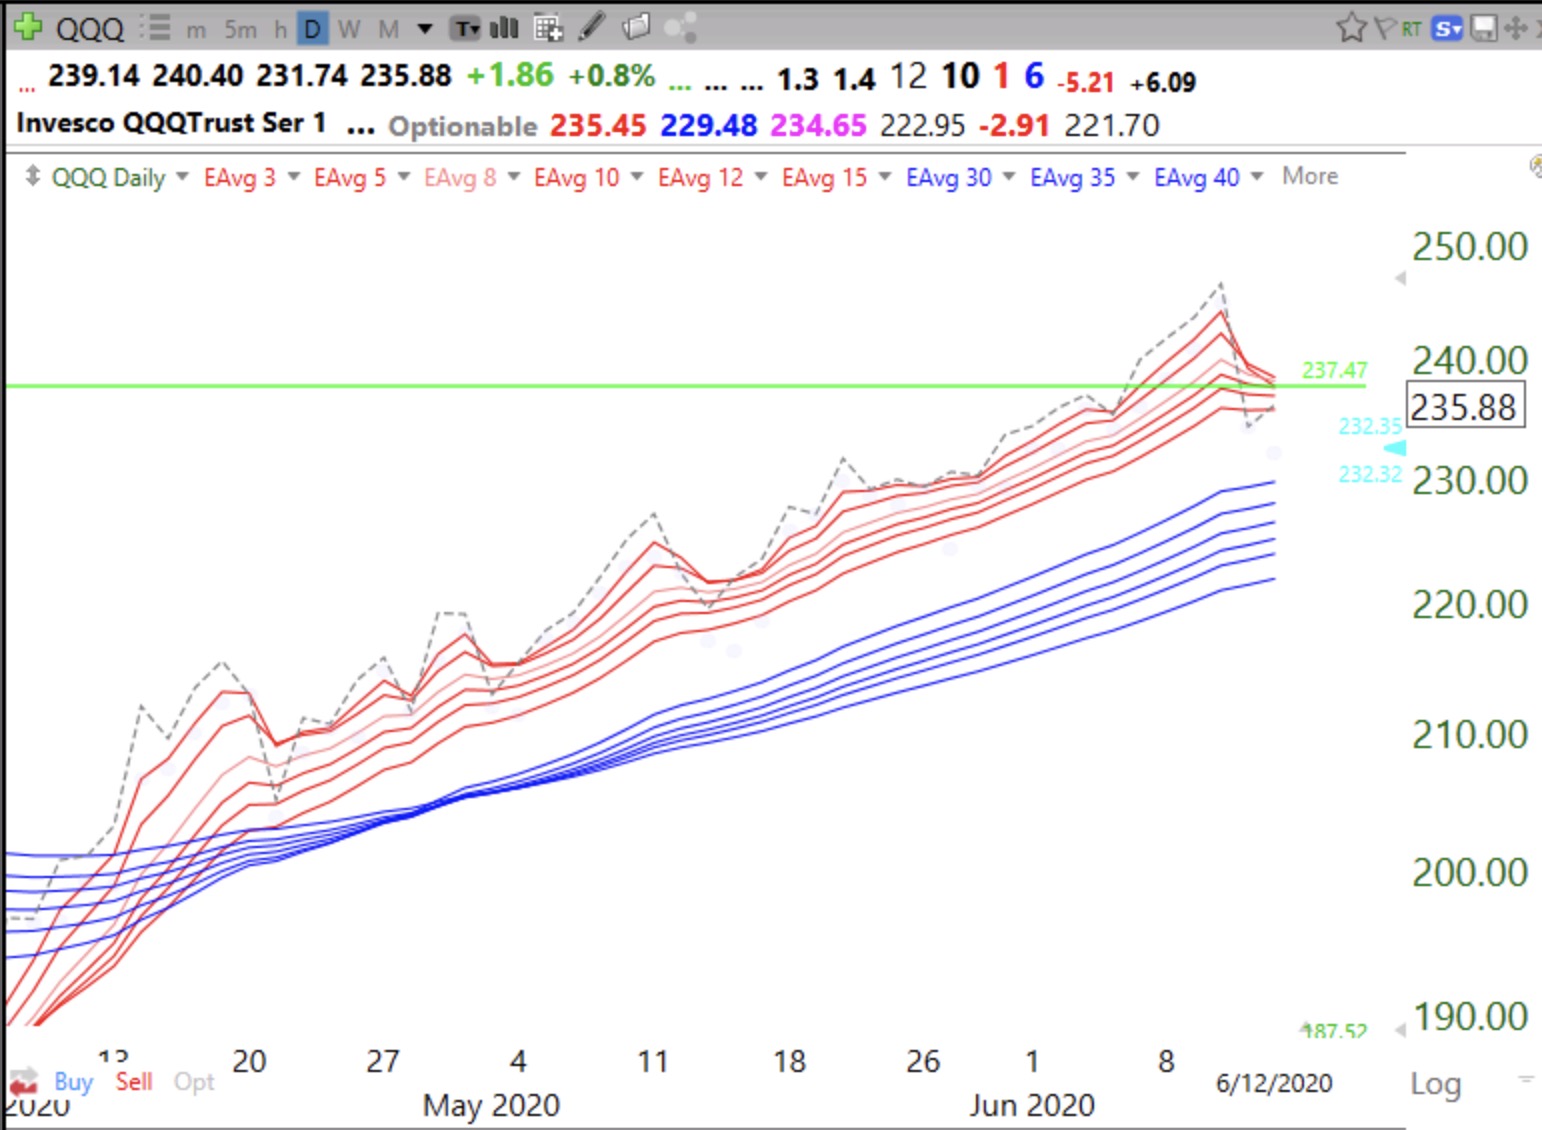
But we are still in a daily RWB up-trend.