As I get closer to retirement and to withdrawing funds from my trading accounts to live on, I have been reluctant to buy individual growth stocks because of their potential volatility when bad news or earnings are released. But I cannot remain in money market funds because of their dismal returns. So what to do? As ETFs have become more popular, many now concentrate on narrow sectors rather than representing an entire general market index, like the SPY or QQQ. Recently, I have begun experimenting with scans to find the most outperforming ETFs and have found that there are some that have even doubled over the past year. Not too shabby for a basket of stocks. When I looked at the ETFs yielded by my scans I was amazed to find how clear a picture they paint of the best sectors of the market where the big money is flowing to. These ETFS contained multiple stocks and were less volatile than individual stocks, which results in smaller draw downs.
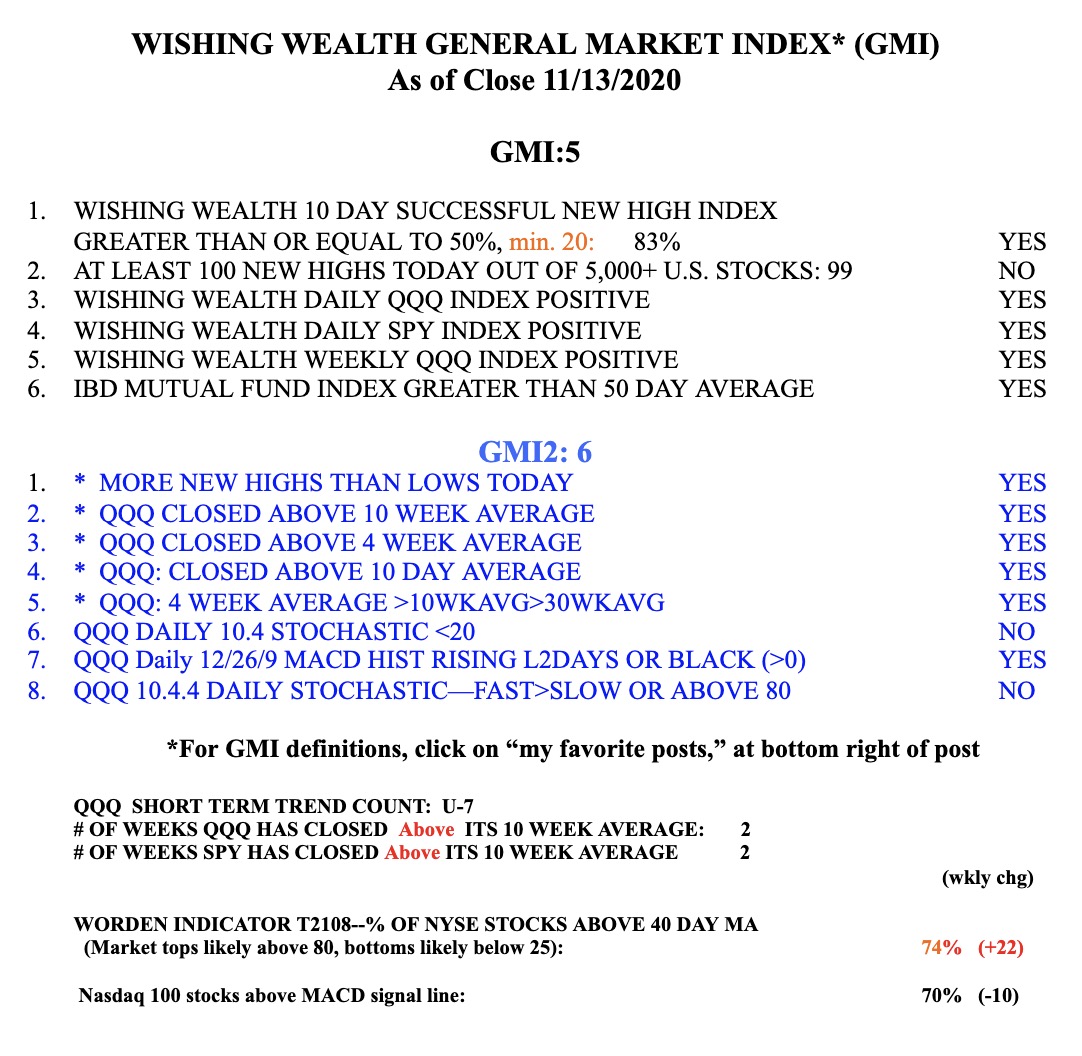
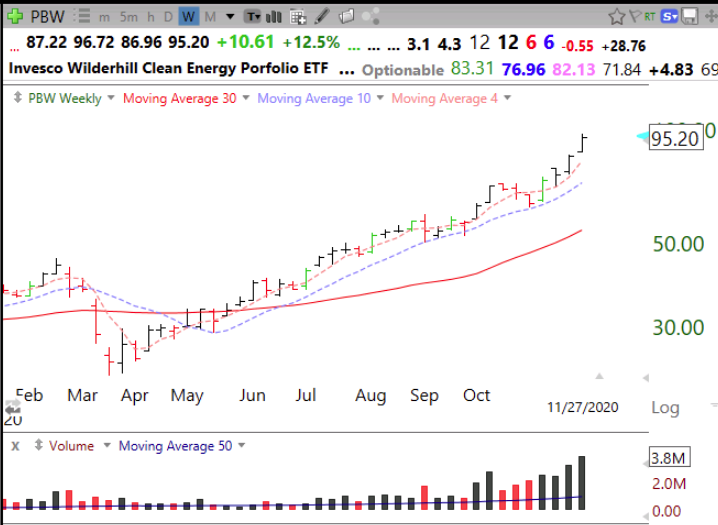
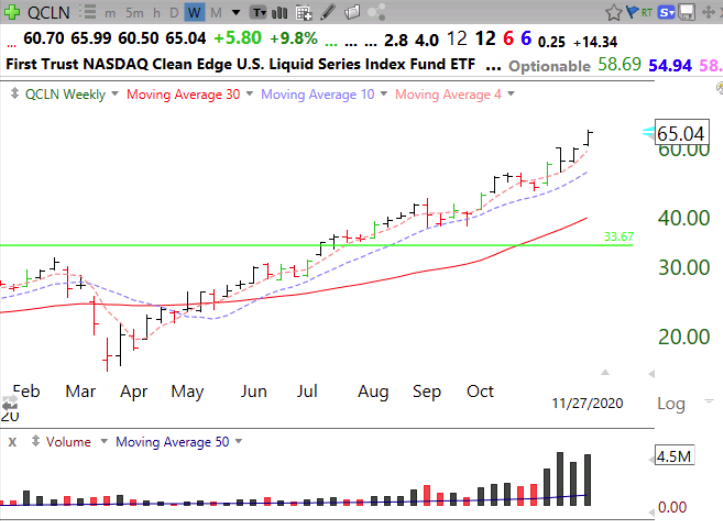
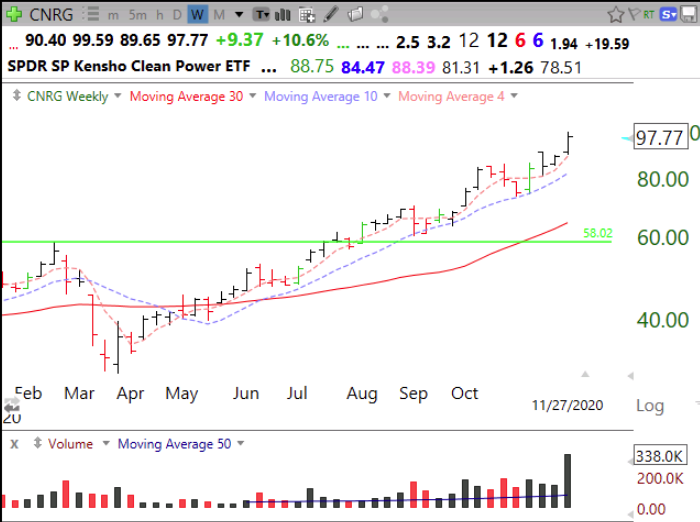
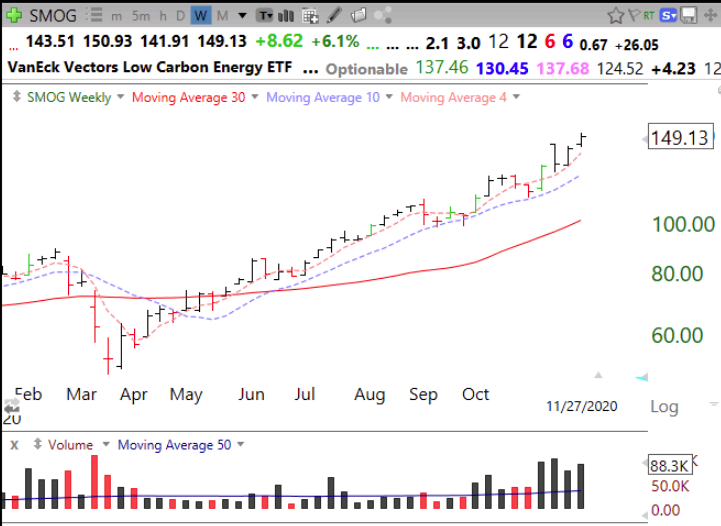
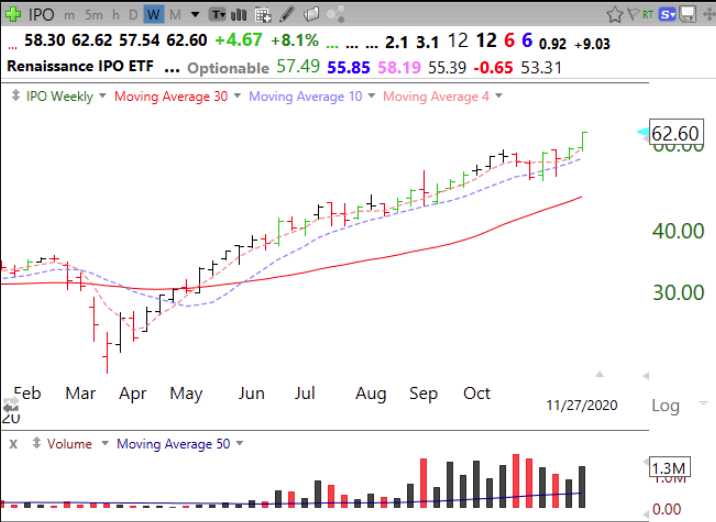
For example, this weekend I ran this scan of all ETFs listed in TC2000: Hit a 50 week high last week; Volume last week was ge 2×50 week average volume; closed higher last week than prior week; closed gt $20. I then sorted the results by current close/price a year ago to find out how much the ETF advanced since a year ago. These filters yielded 12 ETFs that have advanced 190% or more: PBW QCLN CNRG PBD SMOG ICLN LIT IPO ARKQ CHIQ ARKF XBUY. The amazing thing to me was what I discovered when I looked at the focus of each of these stellar ETFs. Seven of the 12 were involved with clean energy or environment. The rest were involved with China or online retail or IPOs. (Just beyond these were ETFs on electric vehicles.) Remember, all of these ETFs hit a yearly high last week on more than twice their average weekly volume. Here is where the big money managers are placing their bets. When Jesse Livermore would buy a steel stock, he felt more confident of his judgment if other steel stocks were acting strong. A strong ETF like these implies that similar stocks were also acting right.
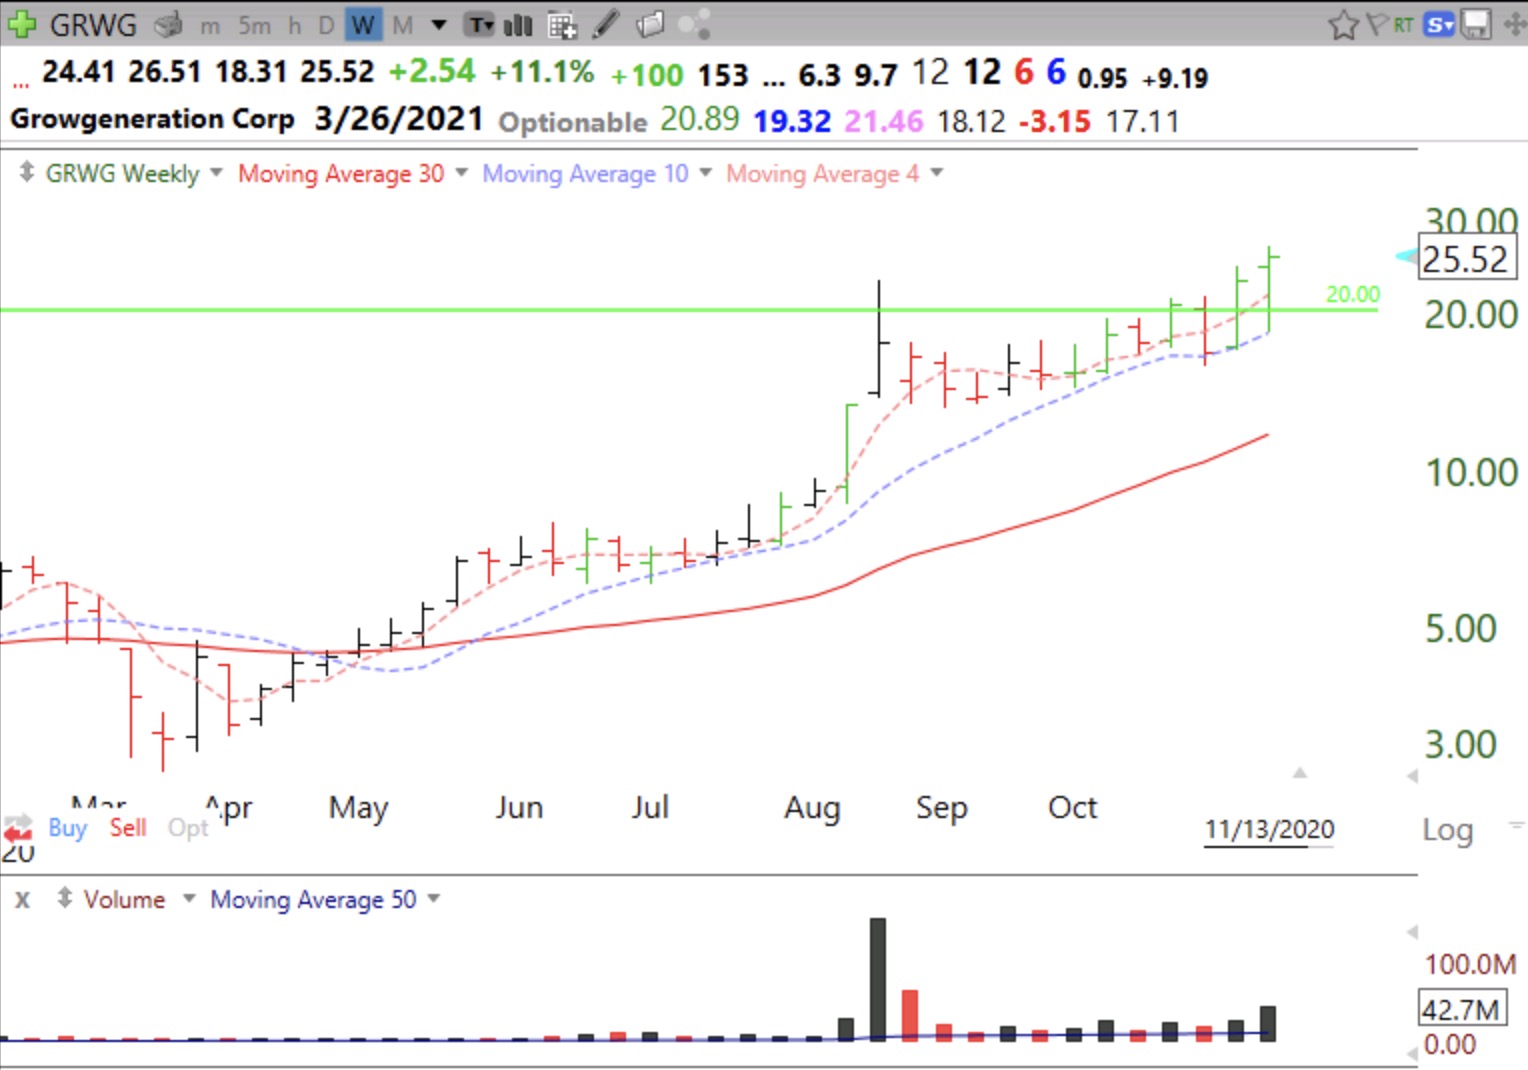
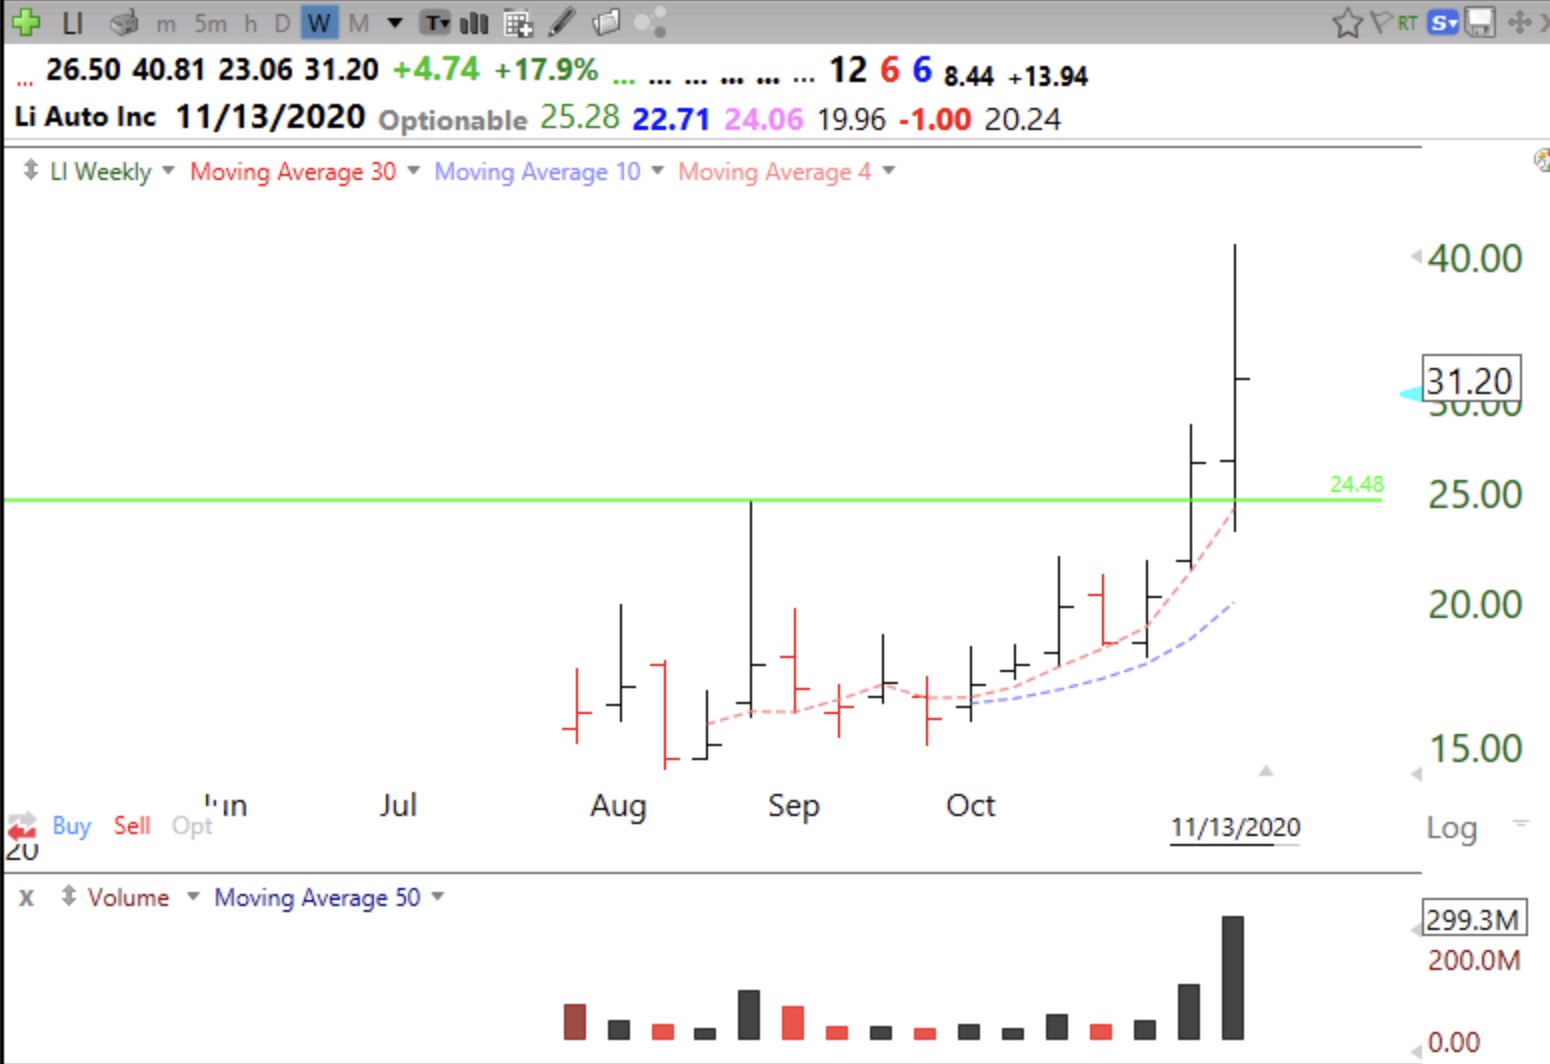
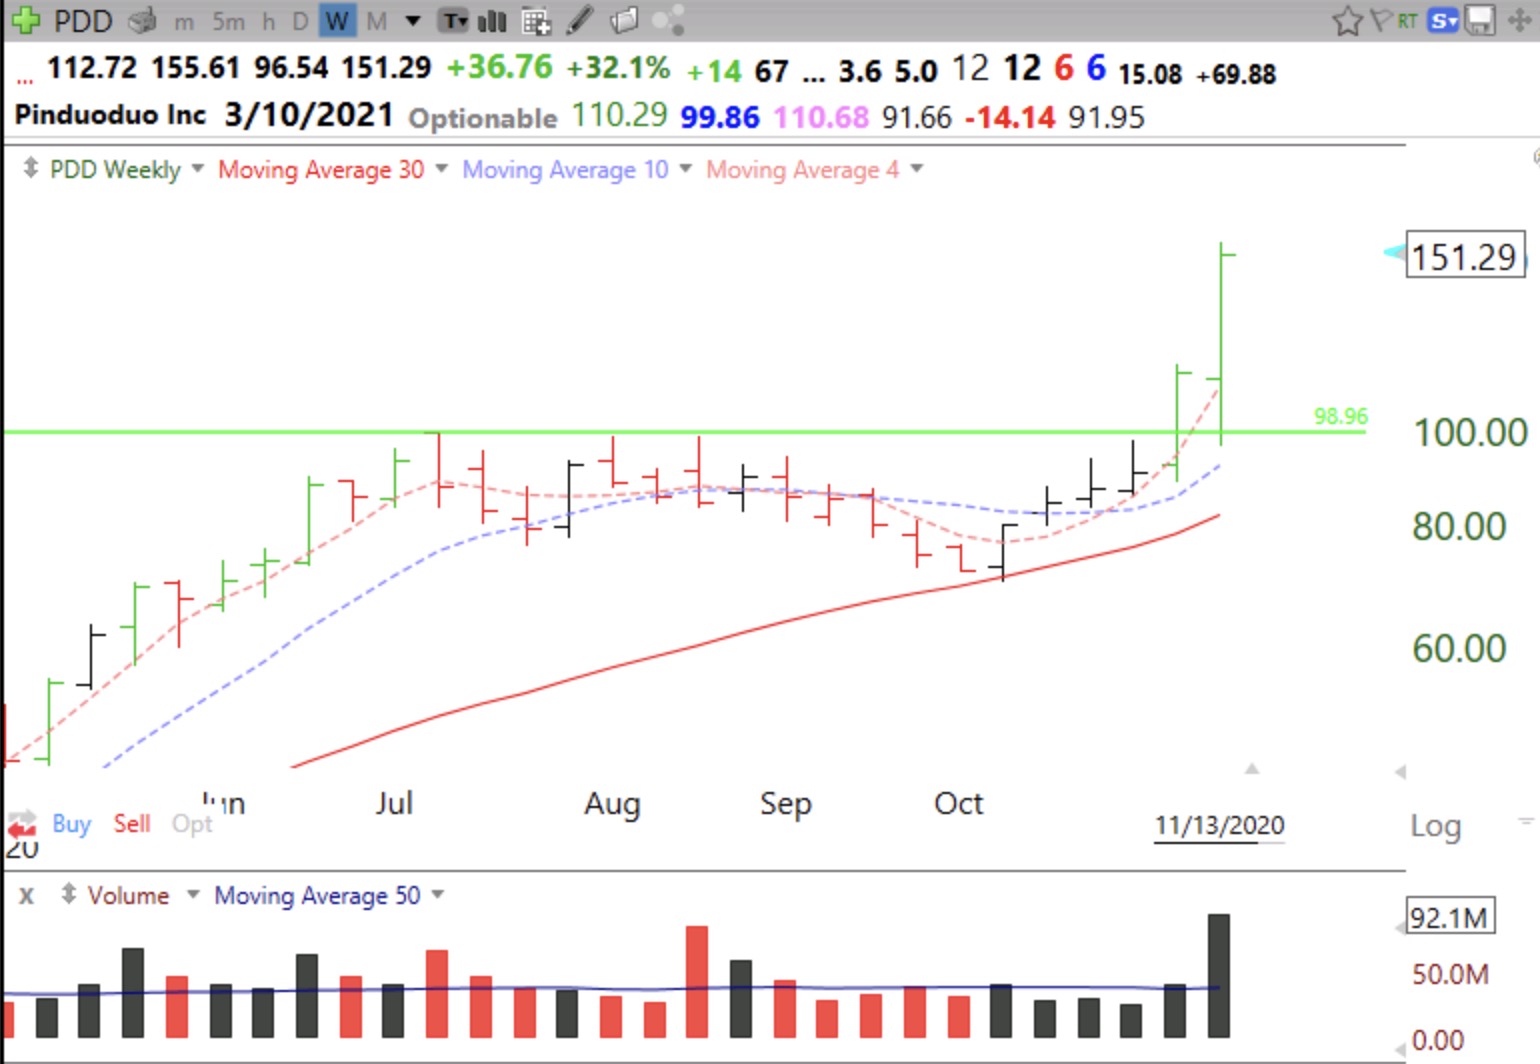
When I next looked at the weekly charts of these ETFs, I found they had great technical patterns, all having 4wk>10wk>30wk averages. All held their 10 week averages for long periods. Such ETFs are where I am now willing to invest for the long haul with much less risk than holding individual stocks. I accumulate each ETF in stages. Each purchase must be at a higher price than the previous purchase. When will an up-trend end? No one knows. But a weekly close below the 10 week average would signal rare weakness and lead me to exit. A close below the 4 week average would make me cautious and a WGB (weekly green bar–bounce up off of the 4wk) might induce me to add to my position. Here are some weekly charts of a few of these ETFs. Note the recent high volume buys and the WGB signals. My students would understand all to be in “yellow band” patterns–the pattern of monster stocks, and now ETFs.
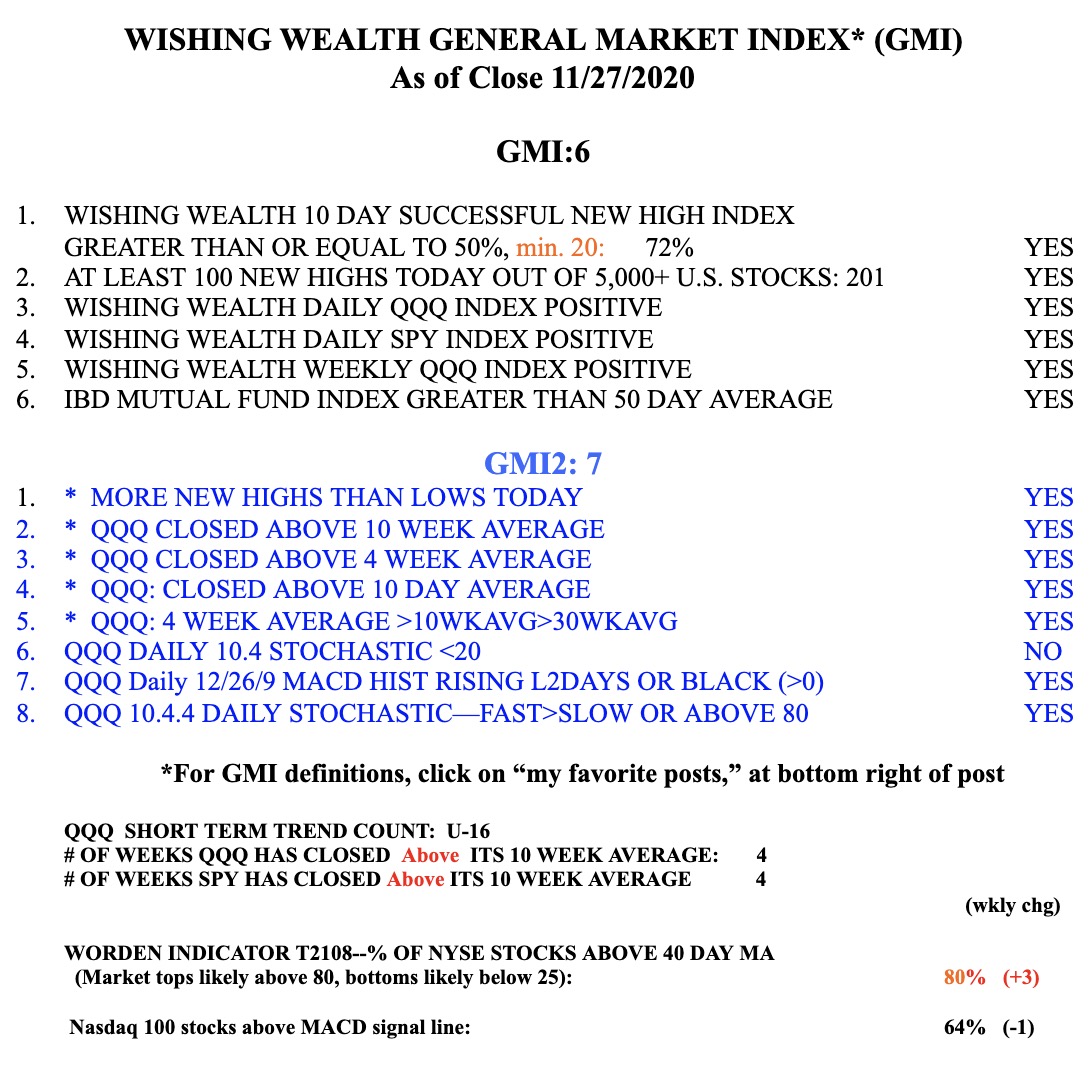
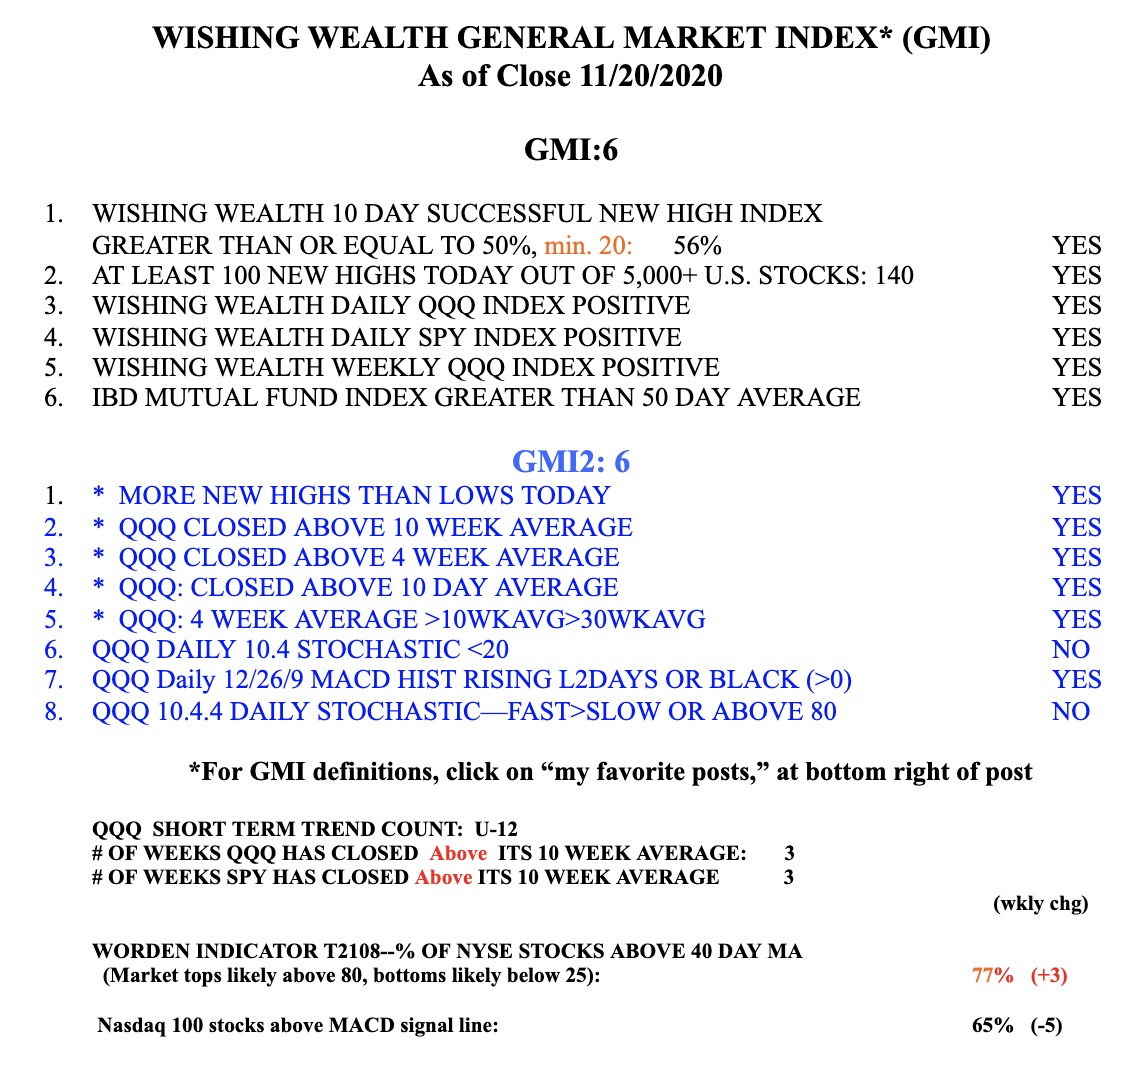
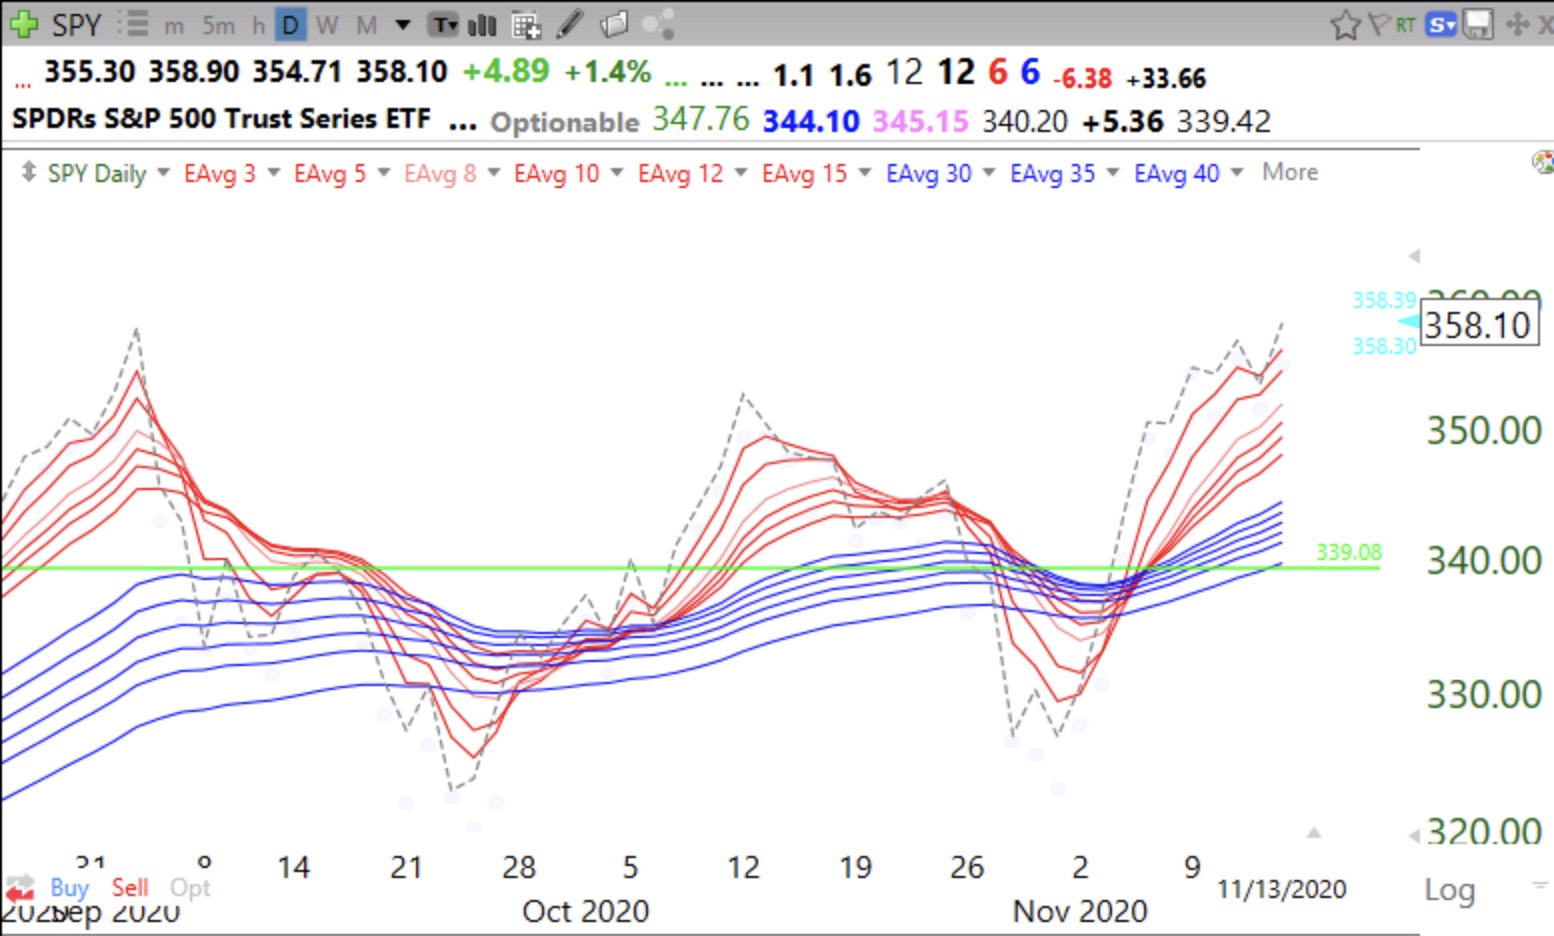
Meanwhile, the GMI remains Green with all components positive. Nice to be swimming in the direction of a rising tide.