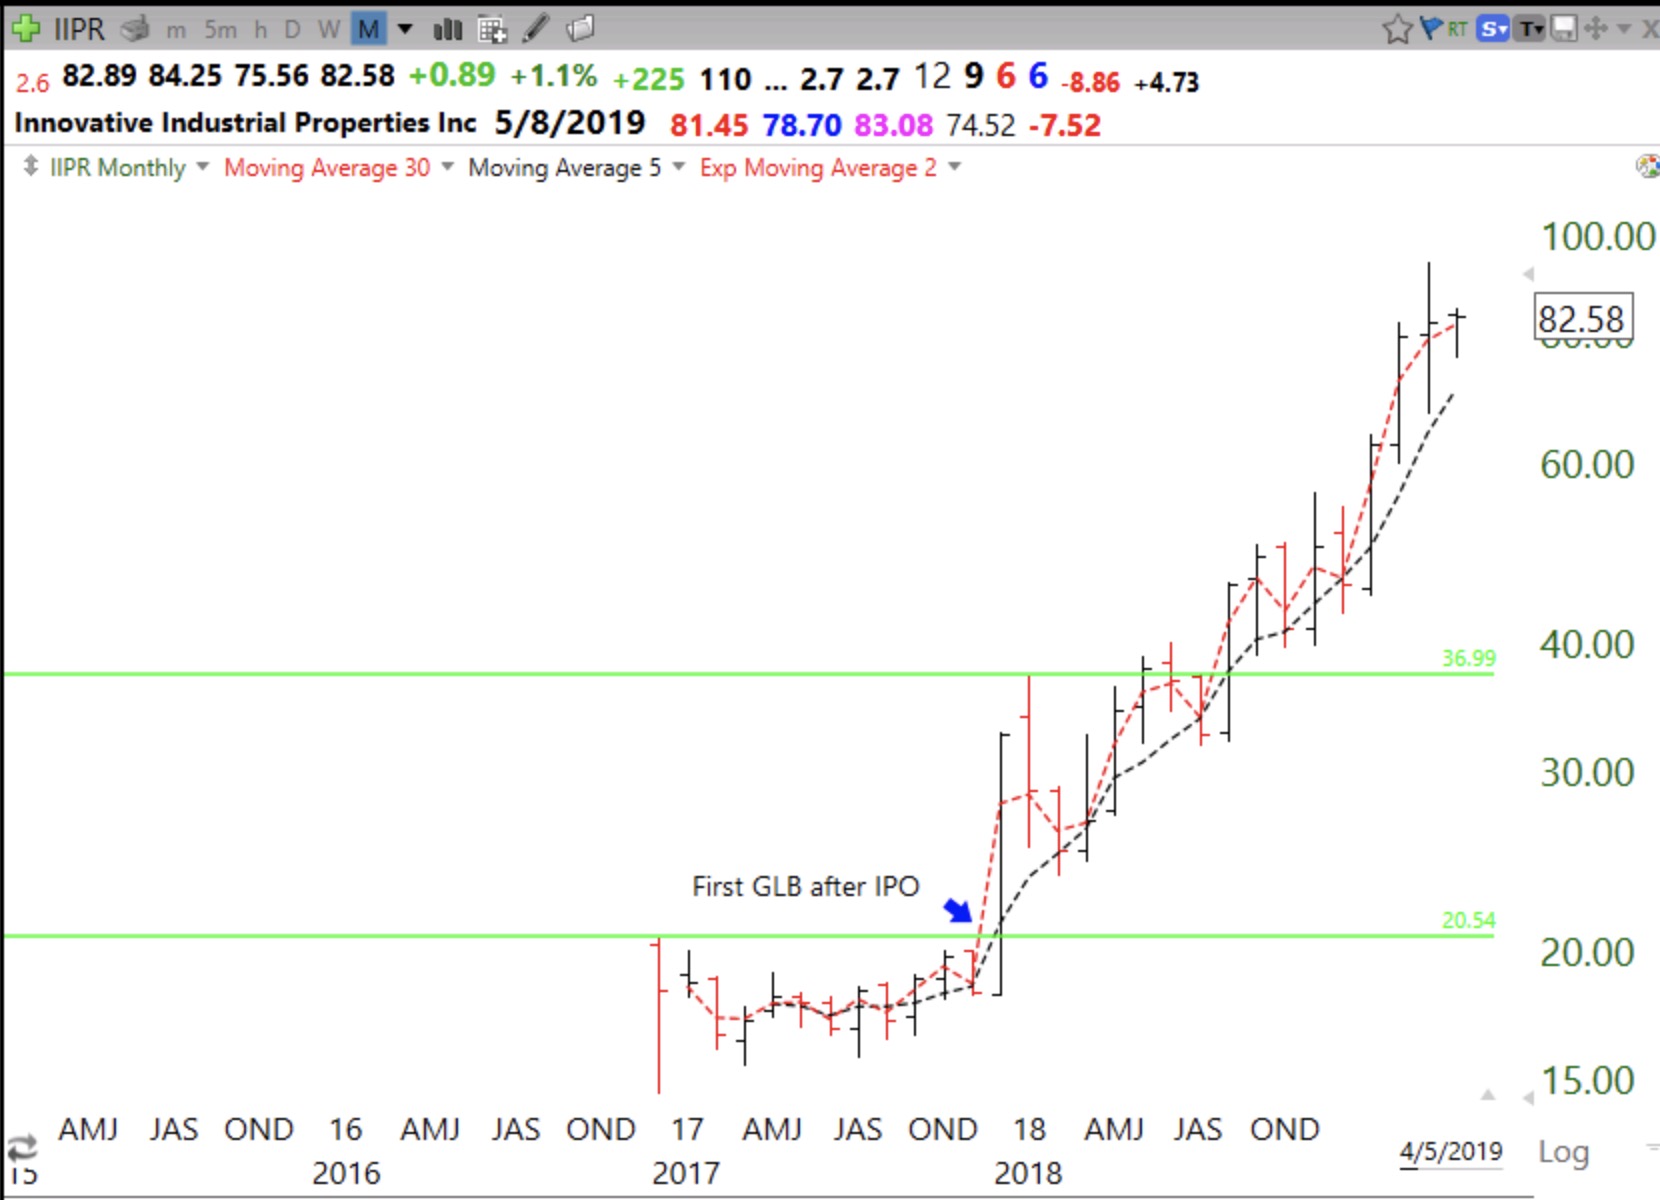
People seem to be re-discovering the value of trading recent IPOs that have broken out, but Jesse Livermore wrote about such a strategy almost 100 years ago. He said to wait for the IPO to settle and to then trade at an all-time high. My green line strategy uses a similar, very simple strategy. For any given IPO that has been trading for several months, I draw a green line at a peak price that has not been exceeded for at least 3 months and wait for the stock to close above the green line, what I call a green line break-out (GLB). One is basically waiting for an IPO to hit a peak, rest for several months, and then to trade at an all time high. This approach has often worked. For example, it took FB a year to have its first GLB, at $45, about 17 months after it came public. That would have been a great time to purchase FB. Some IPOs may retreat from their peak and never have a GLB. The idea is to wait for the GLB before buying the stock. Once I draw in the green line, I set an alert in TC2000 to contact me immediately when the GLB has occurred. A good example of a successful application of the GLB approach for IPOs is the marijuana related stock, IIPR (see monthly chart below). IIPR came public in December, 2016, formed a green line top at 20.54, and then went sideways for about a year. It had a GLB in December, 2017, and then went on to quadruple. (It also had a second successful GLB 8 months after the first.)
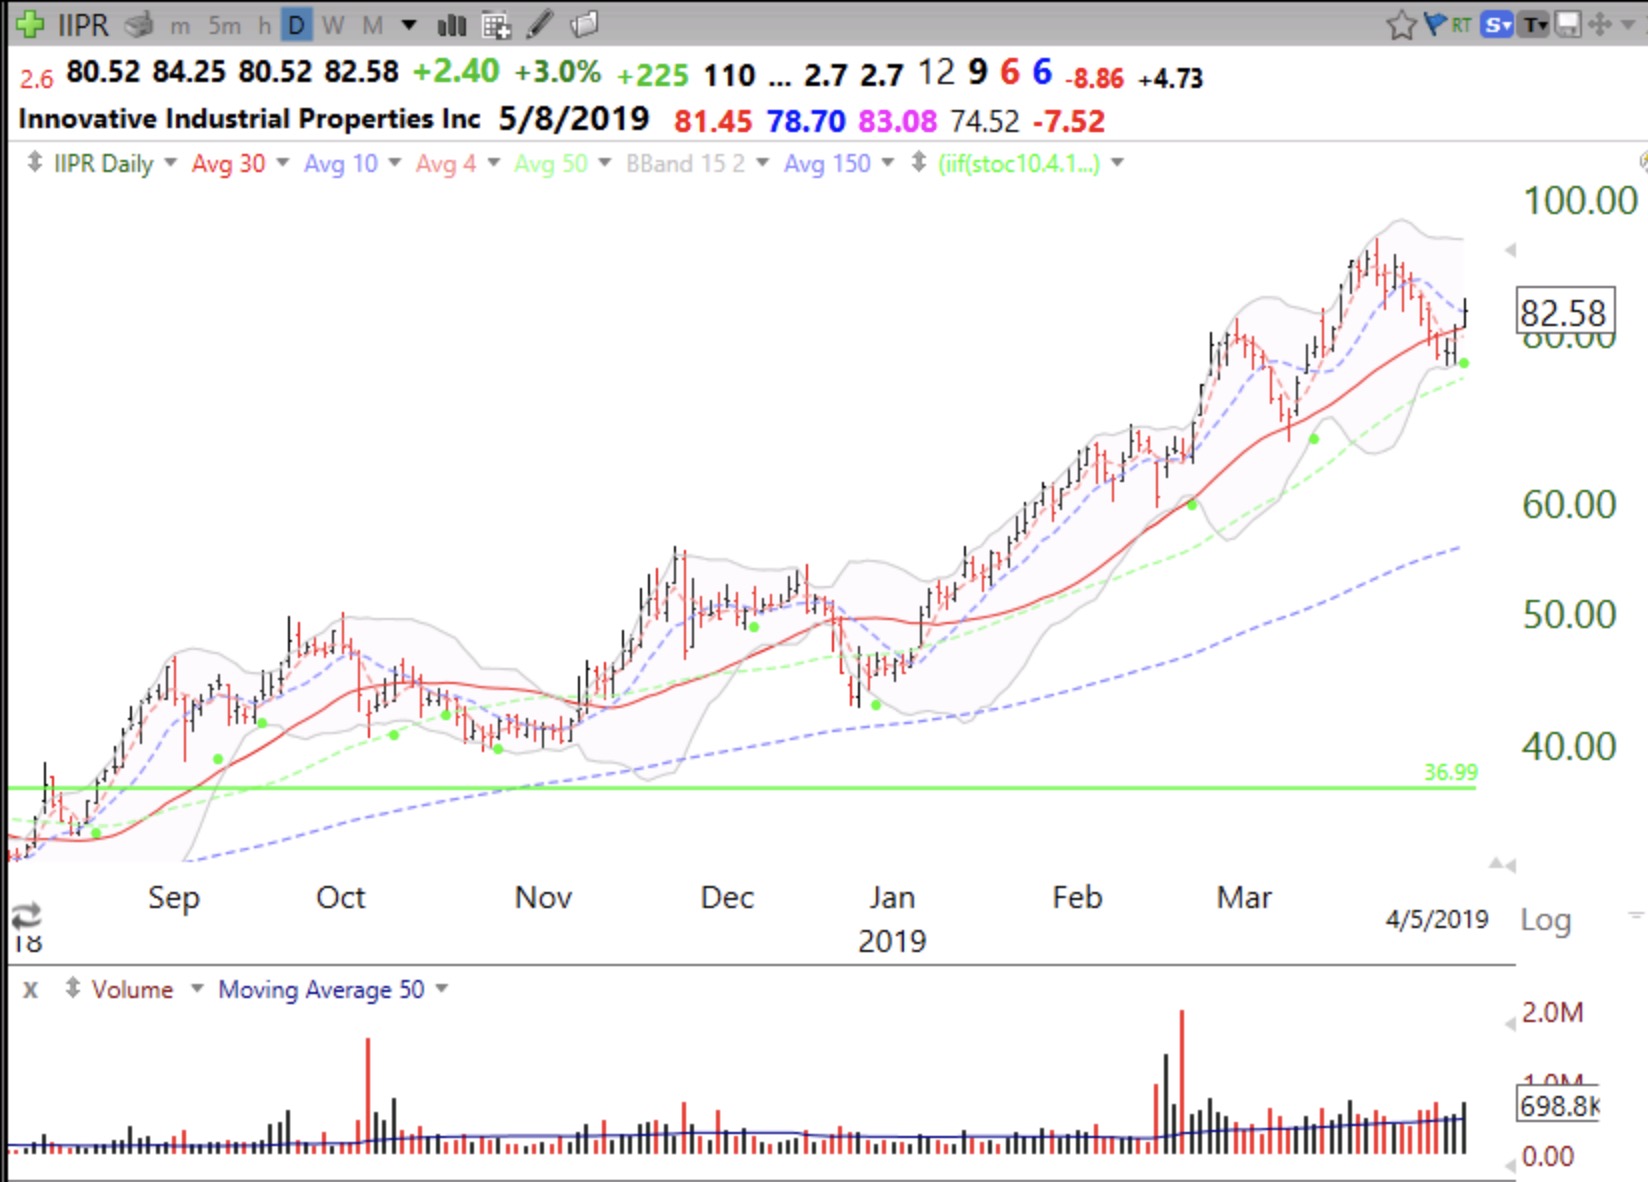
If I missed the GLB, it still may not be too late to buy it. I just look for my favorite green dot daily indicator signal for a good time to climb aboard. The stock must also be trading above its last green line top and preferably, its 30 day moving average (solid red line in chart). Note on the daily chart below how one could have purchased IIPR at several recent green dot signals. The most recent green dot occurred on Friday. Any green dot set-up can, of course, fail, and I always place a stop below the recent low of the green dot bounce. By the way, I do not trade IIPR, because I am in the business of researching drug abuse. That is a conflict of interest and I keep clear of the weeds…. You never know how high these marijuana stocks will get, though.
For those with TC2000, you can access my club and view a tutorial on how to automatically add green dots to your charts. Or you can select the tab above my blog that says “TC2000 Scans.”
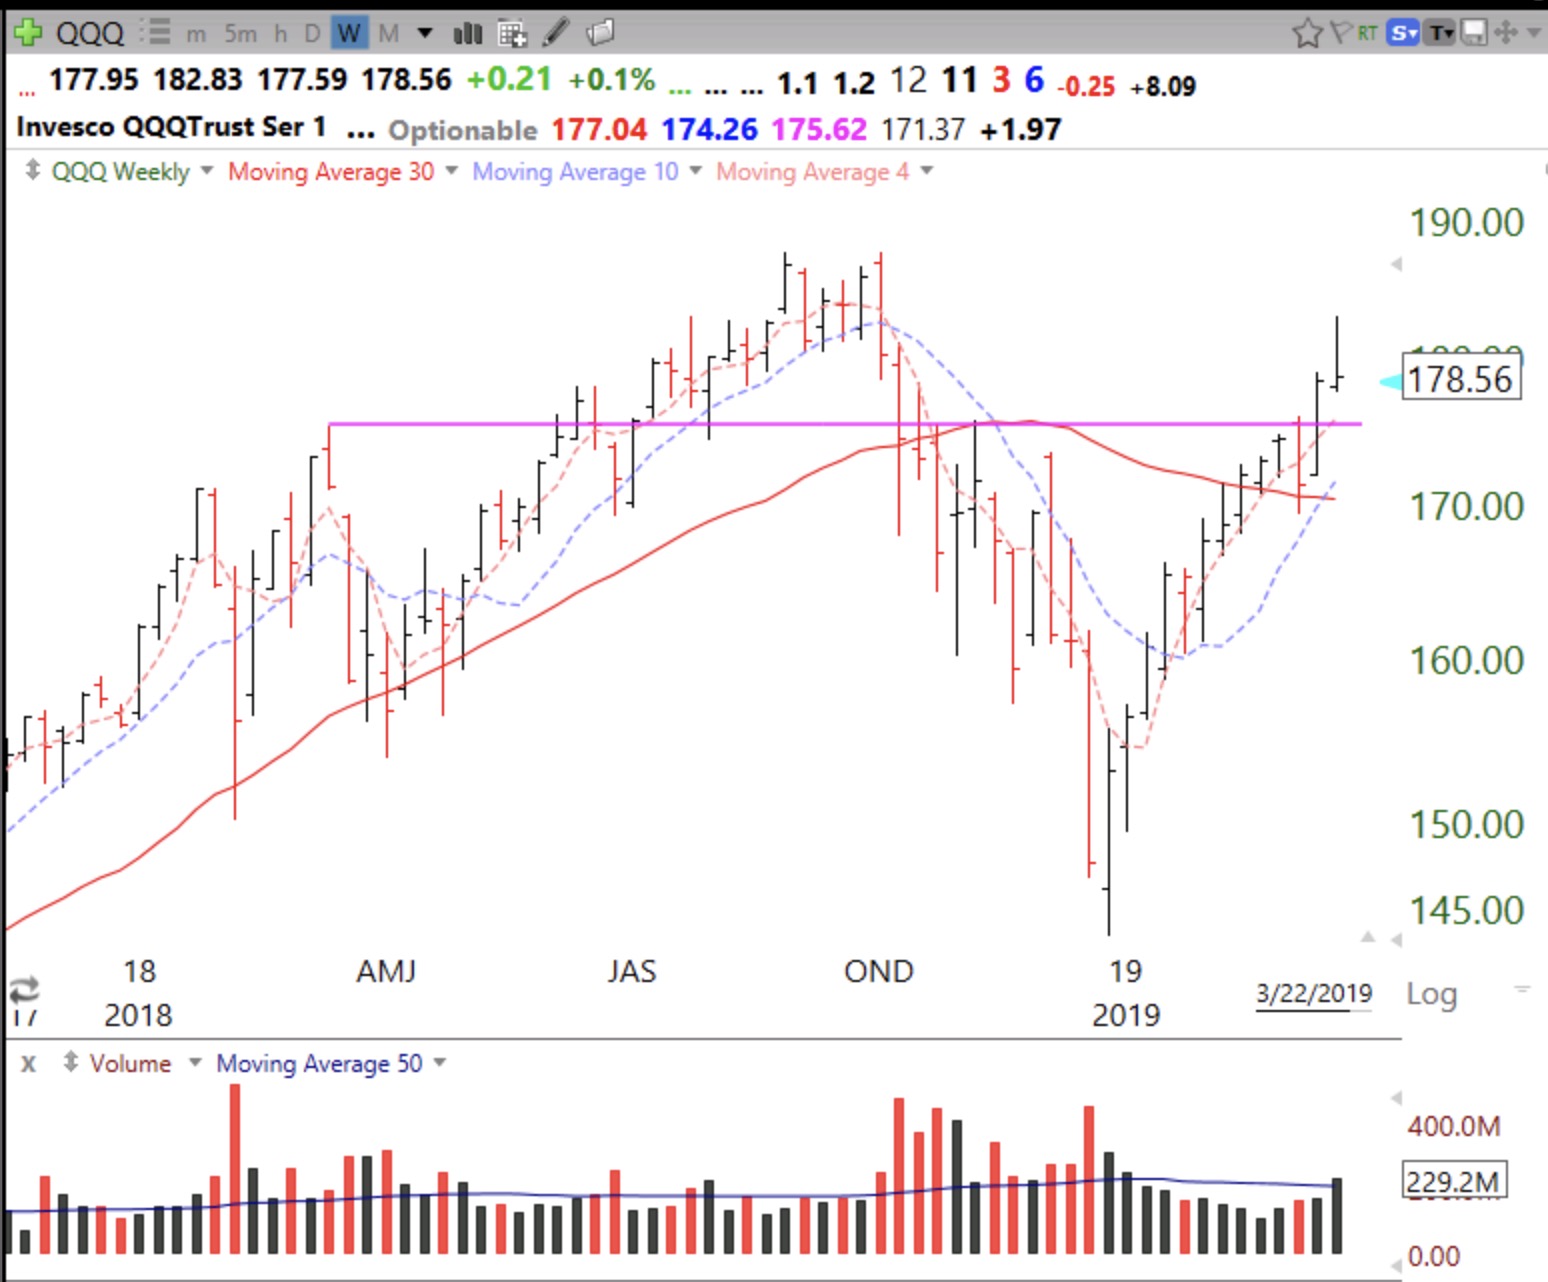
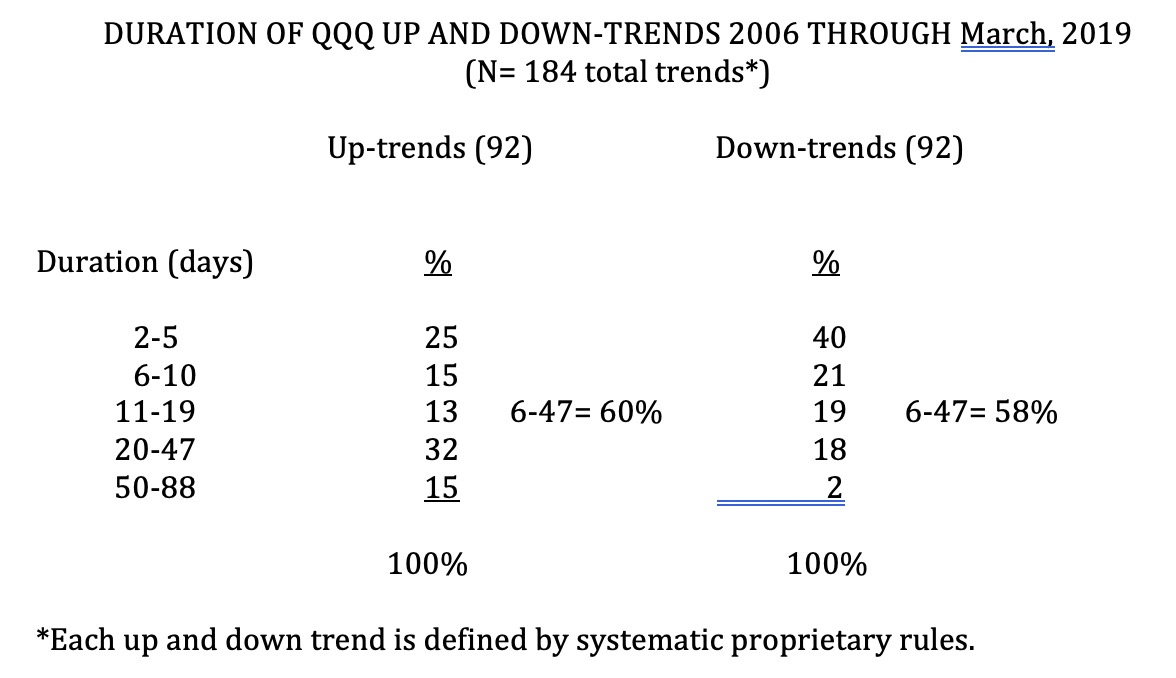
My co-instructor and IT genius, David, updated my short term QQQ trend count table through March, 2019. It still shows that up-trends are more likely to last longer than down-trends and that there are more frequent very short down-trends that last only 2-5 days (40% vs. 25%). I therefore wait until the 6th day to trade on a new down-trend. About 60% of up and down trends last between 6-47 days. The current QQQ short term trend count is shown weekly in the GMI table (see below), and is now an up-trend, U-61 (61 days). Note that the longest up-trend in this 13 year period lasted 88 days and the longest down-trend was 69 days. Going back to 1990, there were two longer up-trends, of 100 and 152 days. and two longer down-trends which lasted 76 and 88 days. A short term down-trend usually signals a rest and not the start of a bear market.
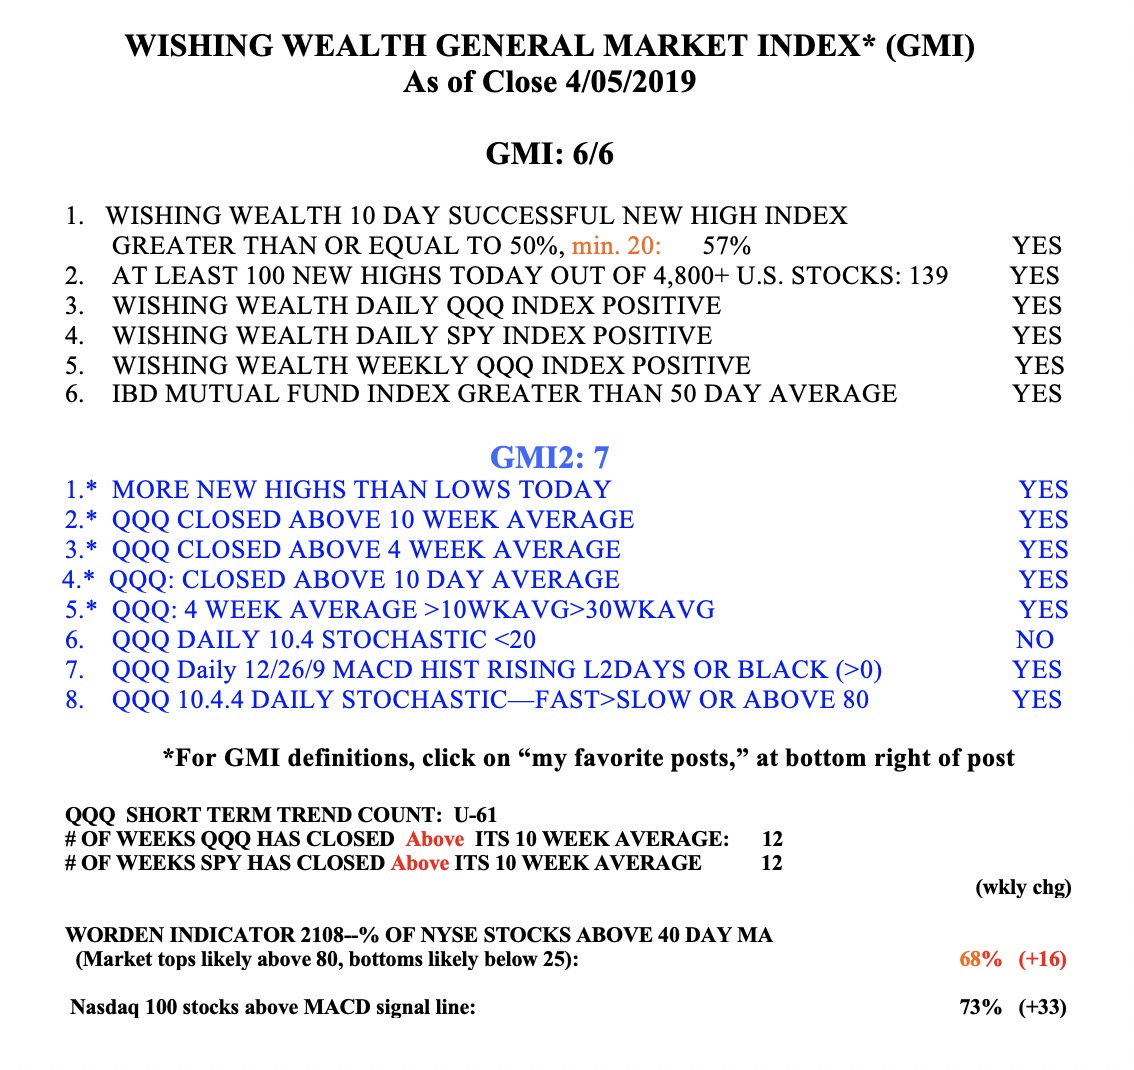
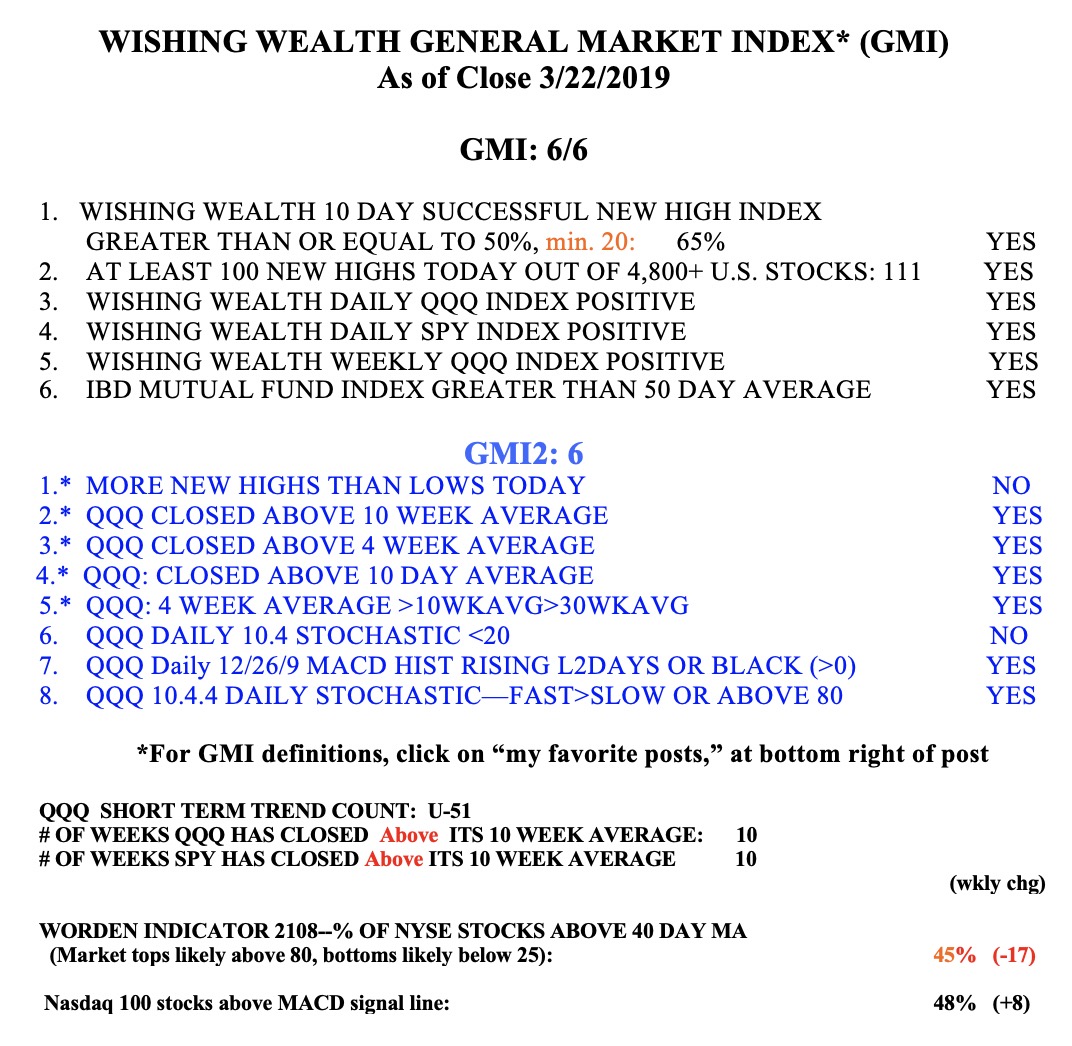
The GMI remains Green, at 6 (of 6).