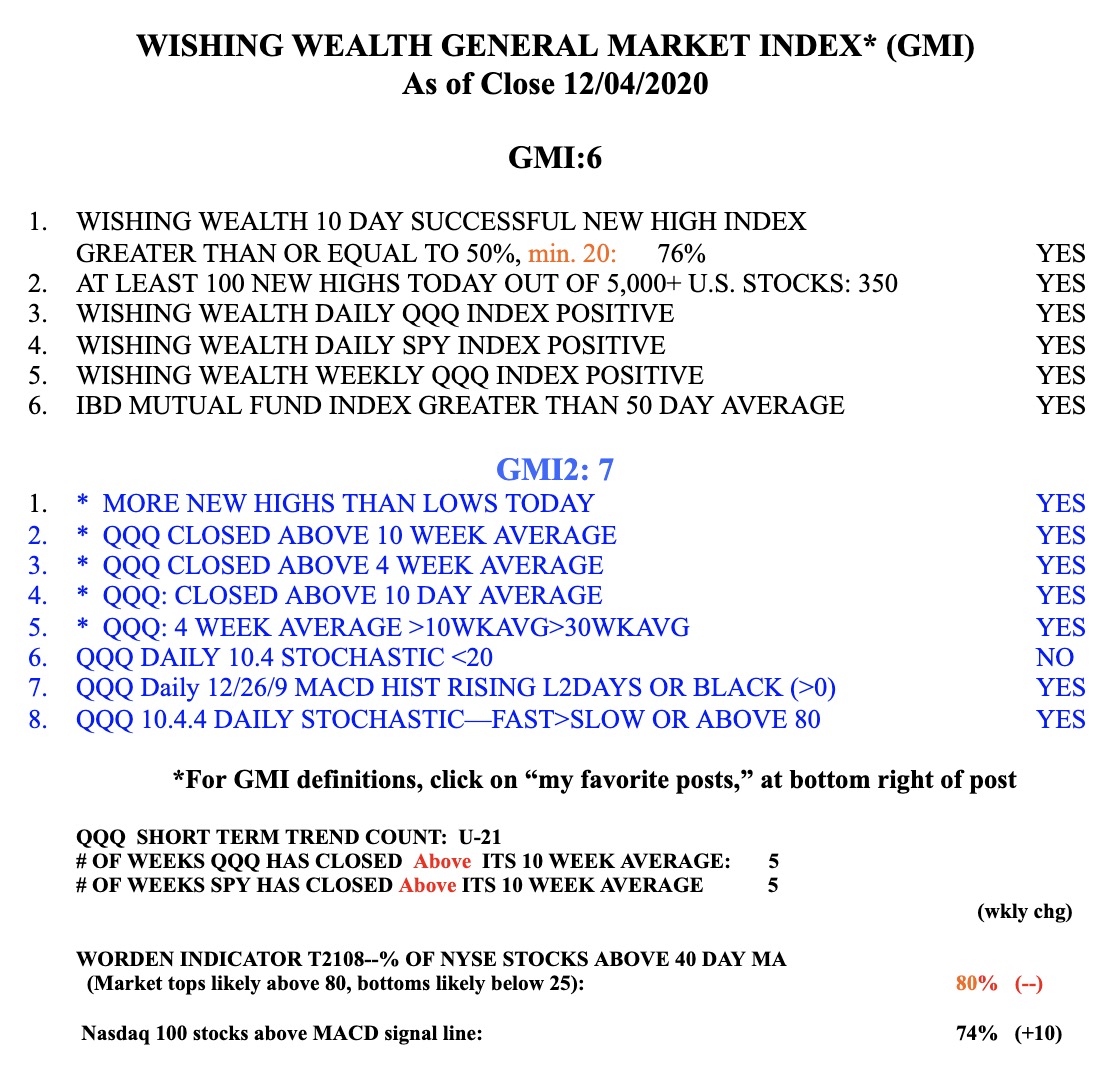
One of the best ways to trade a recent IPO is to wait for it to form a green line top (a horizontal line drawn on a monthly chart at a peak price after it has not been exceeded for at least 3 months) and then buy it after it finally closes above that green line, hopefully, on above average trading volume. As soon as I draw the green line, I set an alert on TC2000 to tell me when the stock trades above that line. The alert stays active for one year. The idea is that there is often a lot of euphoria and hype surrounding an IPO when the public may drive the stock to high levels, providing insiders a nice profit. The buying subsides and the stock may then decline and consolidate for months. The time for me to buy is when the stock finally trades above the green line peak at an all time high (a GLB or green line break-out). For example, the monthly chart of Facebook shows it came public in May, 2012 at 42.05. It rose that month to 45.00 when Joe public unfortunately bought it thinking FB must go higher. However, by September, 2012, FB had declined 61% to a low of 17.55 (where Joe public likely gave up and sold it). In September, 2013, 17 months after its IPO, FB traded at a new all-time high (ATH). That was the time I buy. If one bought before the GLB, there was no way of knowing if FB would ever withstand the selling of the persons who had bought earlier at higher prices and then swore that they would sell as soon as they could recoup their losses. When a stock can overcome this overhead barrage of selling and trade at a new ATH, it is providing evidence of huge buying pressure. Trend traders react after the buy signal has triggered, not before. Buying early, in anticipation of a break-out, can kill you. Note in this monthly chart that FB has had 4 GLBs. I like to only purchase stocks trading above their last green line top.
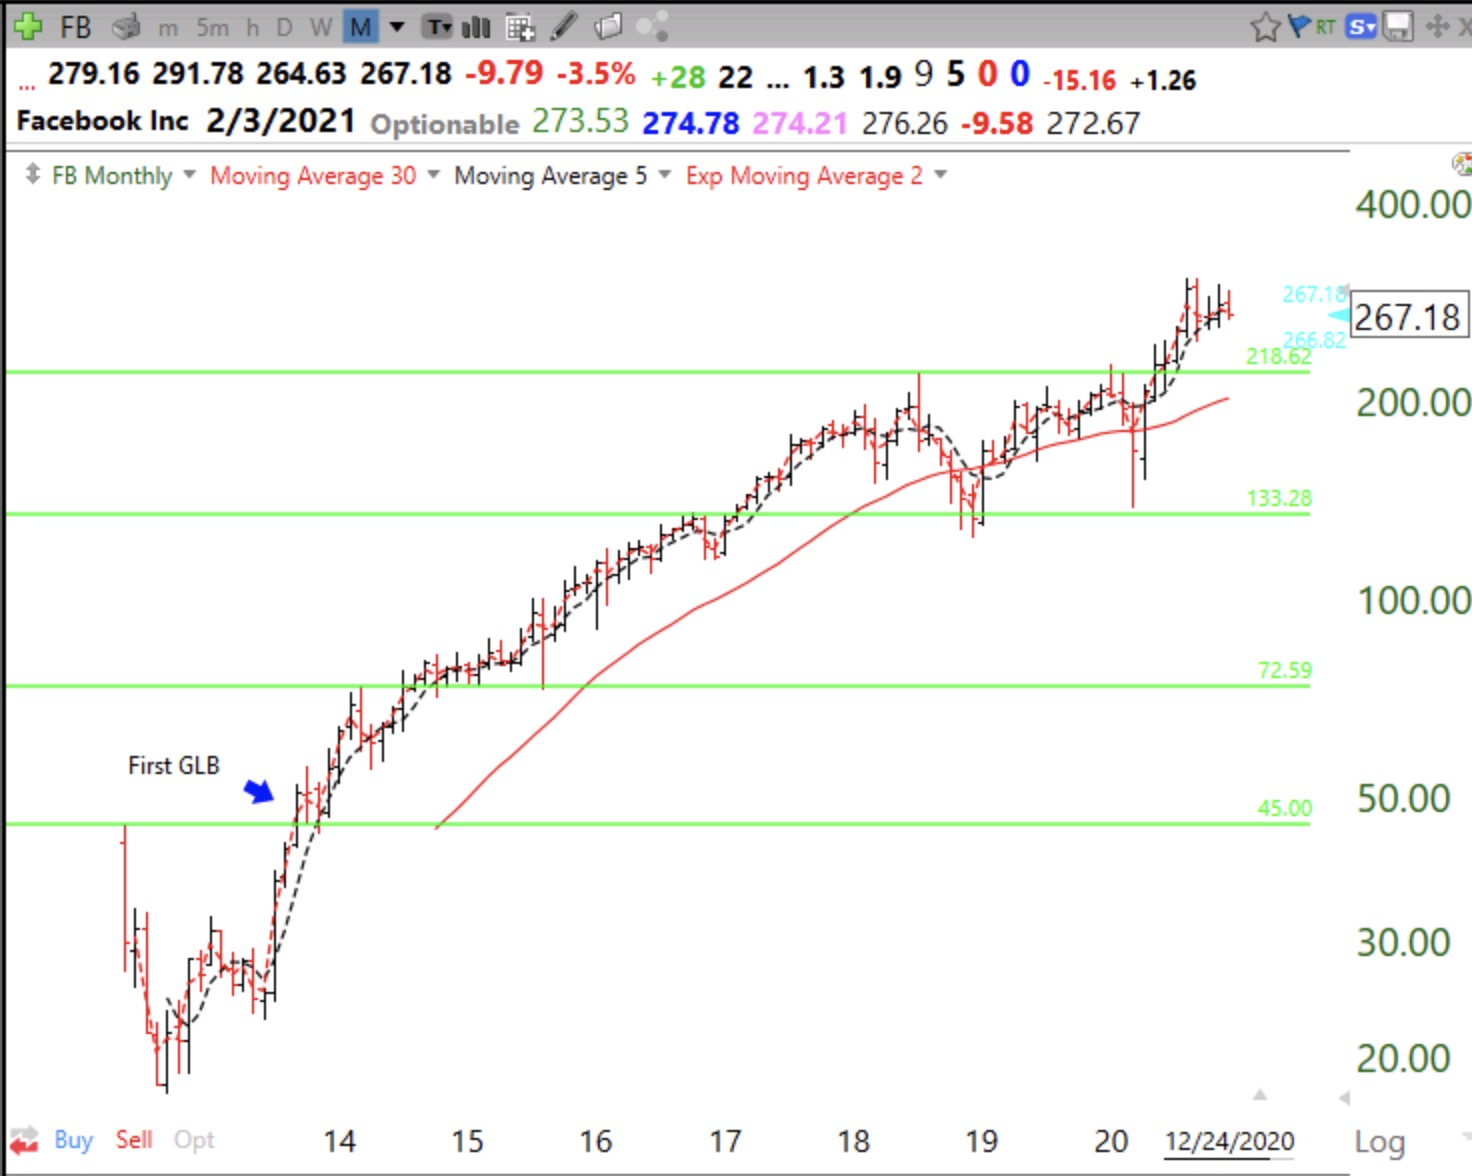
Of course, not every GLB succeeds and some fail or even re-test their break-out before moving up. If I buy a GLB I must sell it if the stock CLOSES any day below its green line. Often times a stock will trade intraday back below its green line only to close above it. To avoid being shaken out on a false move down, I therefore use a mental stop rather than a hard stop loss below the GLB. If I miss the GLB or want to add more to my position, I have found that a promising signal is my WGB (weekly green bar) signal. A WGB is drawn on a weekly chart if by the end of the week, a stock has traded below its 4 wk average and retaken its rising 4 wk average, is higher than the prior week’s close, and its 4wk>10wk>30wk average. Such a situation has just occurred for PGNY. I like PGNY because it is projected to become profitable and it has estimates of growing future earnings, a la MarketSmith. PGNY had a WGB last week, indicating, for me. a possible place to buy, since I did not buy at its GLB 3 weeks ago. If I did buy PGNY on Monday, I would place a stop to sell it if the stock trades below the low of the WGB. I would then keep my stop there until another WGB occurs and then raise the stop to that bar’s weekly low. I have noticed that placing stops at the low of each WGB can help me catch most of the advance. When the stock trades below the WGB and I am sold out I may buy it back after the next WGB. Take a look at PGNY’s weekly chart below. The red dotted line is the 4wk average. A strong rising stock will repeatedly close the week above its 4 week average.
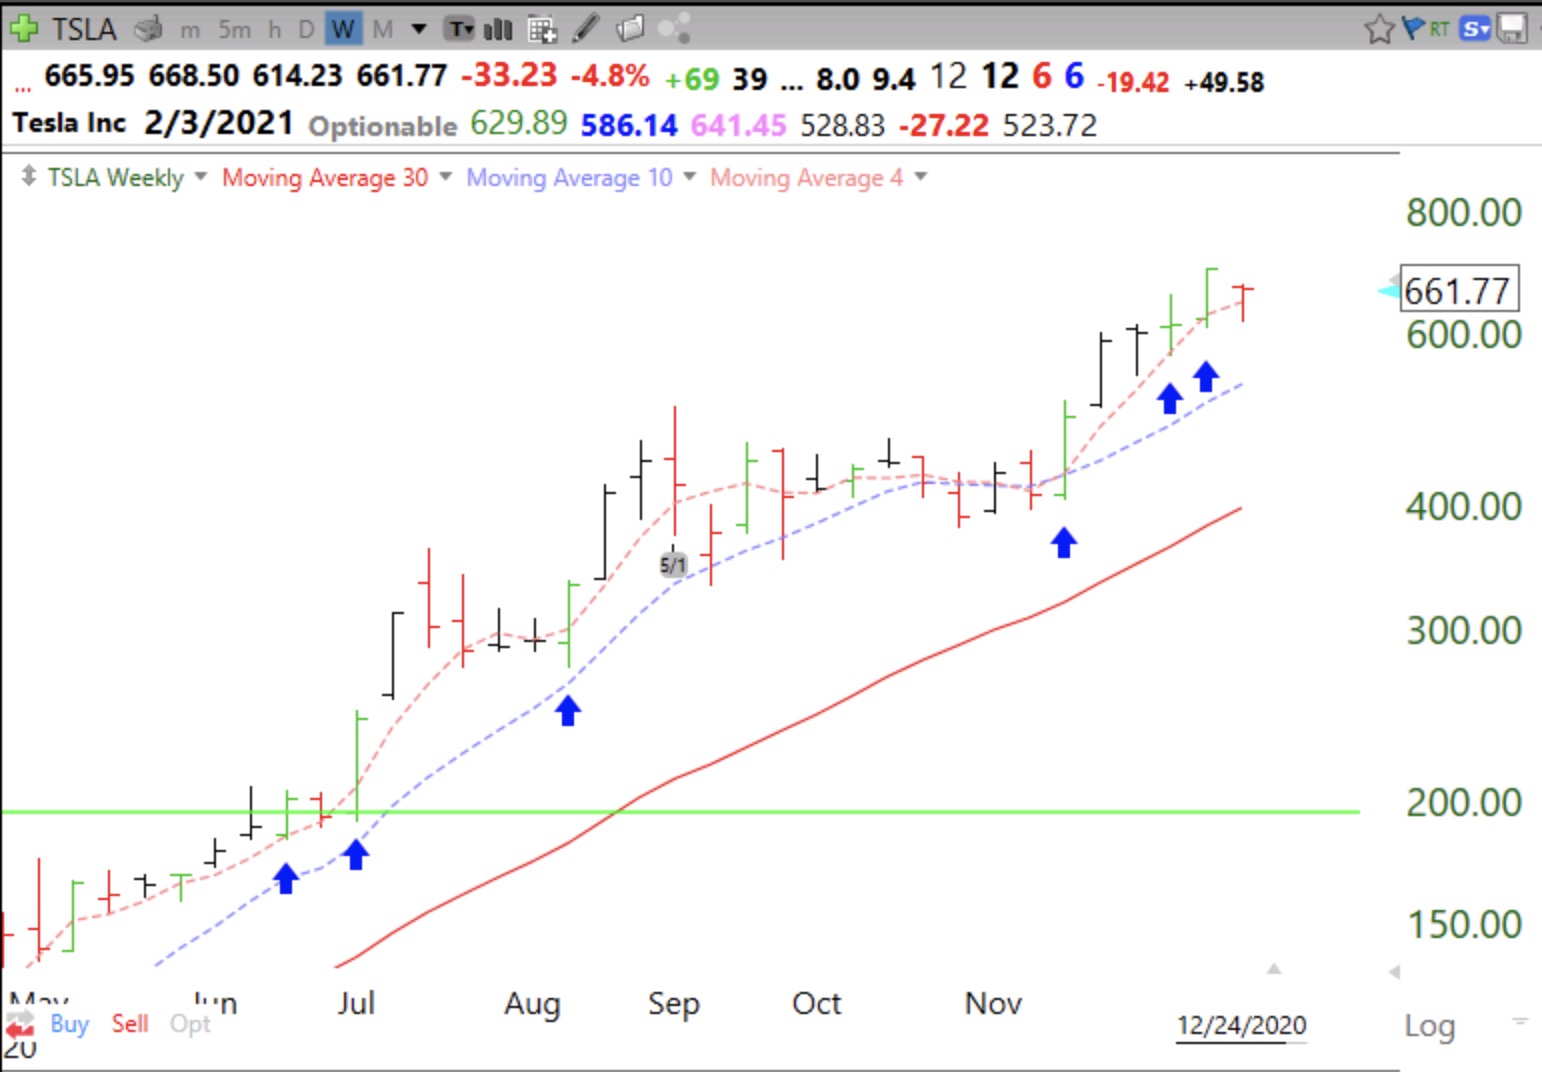
I have marked with arrows the 6 (of 8) WGBs, after a GLB where one could have successfully bought and retained TSLA placing stops according to the above strategy. There is clearly a reason why Bill O’Neil relied mainly on weekly charts to make his fortune.
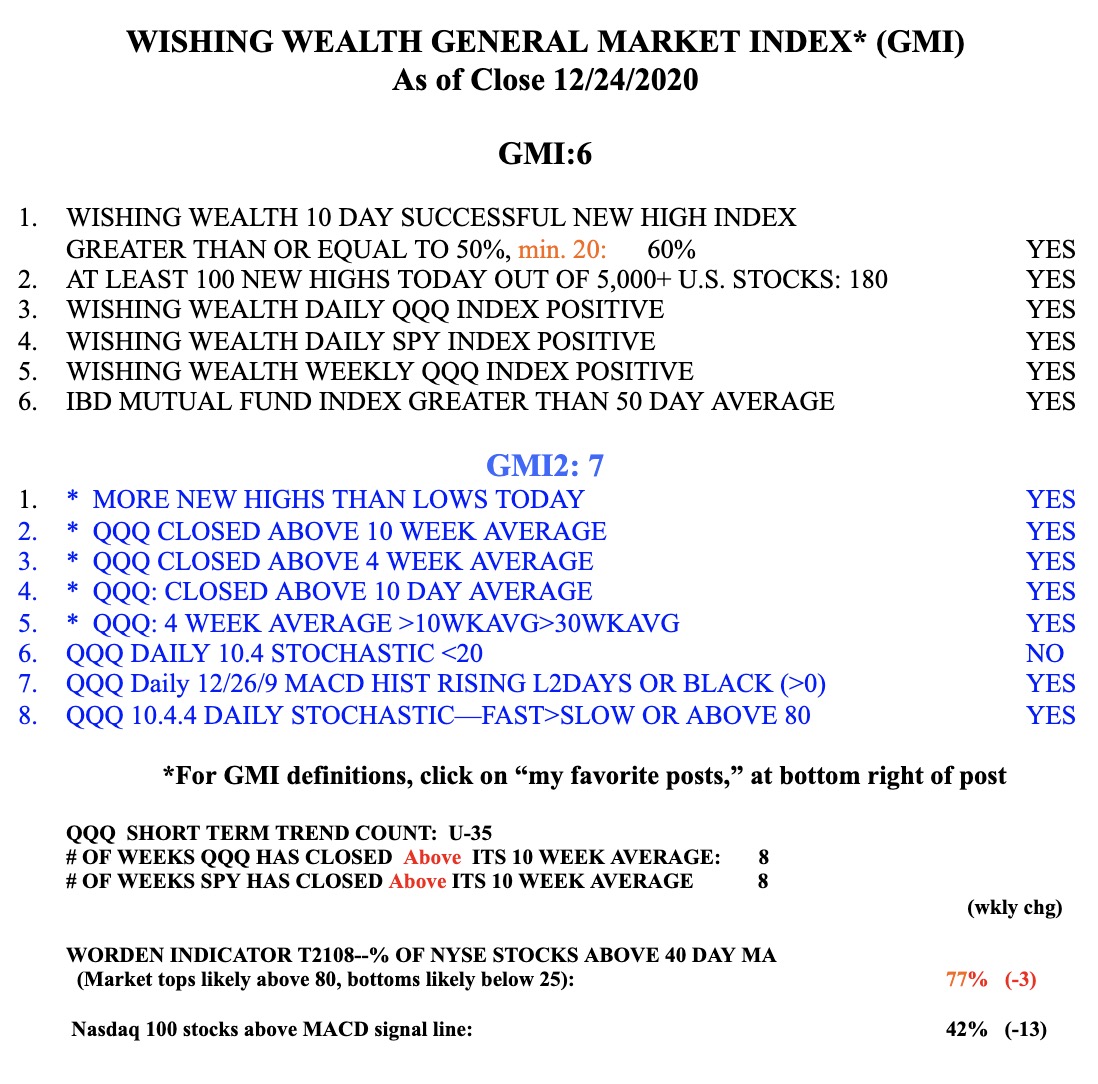
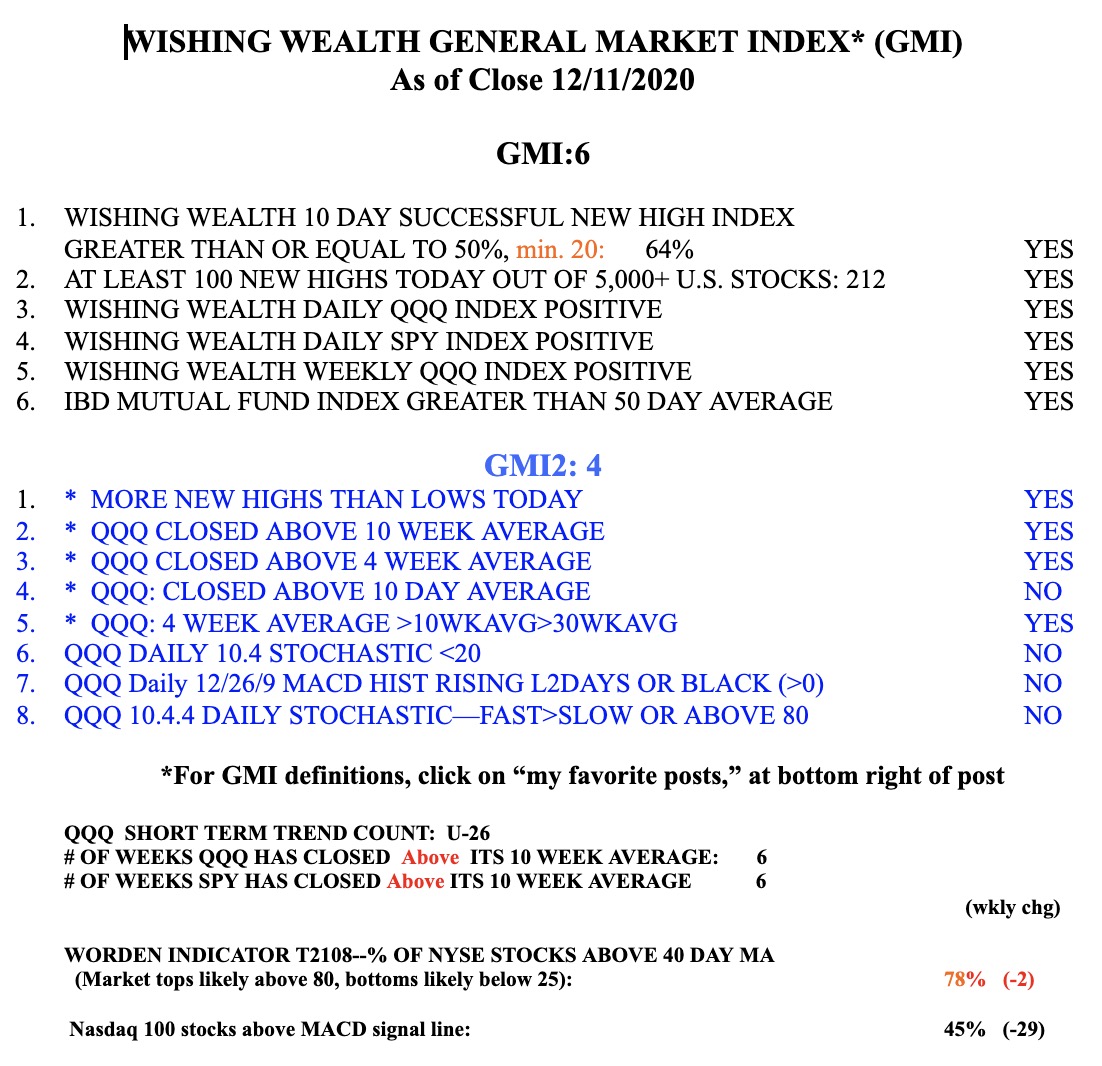
The GMI remains Green and registers 6 (of 6). The GMI keeps me on the right side of the market. All of my indicators remain positive, so the short and longer term trends remain up. Note we have also completed day 35 (U-35) of the current QQQ short term up-trend. Some of these short term up-trends have lasted as long as 80+ days.