Put/call ratio = 1.05, indicating continuing bearishness among option traders. We therefore could see some strength on Friday.
All Posts
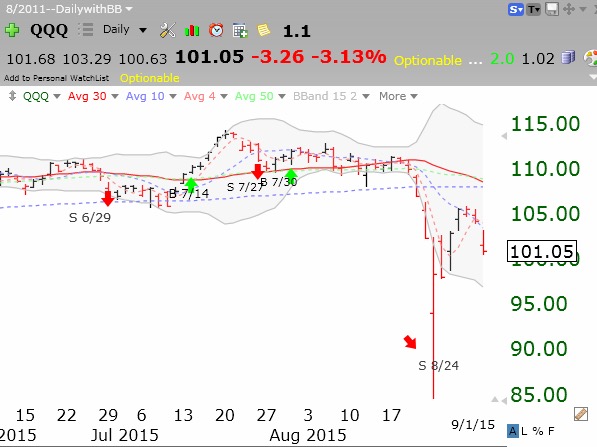
16th day of $QQQ short term down-trend
With the put/call ratio at 1.17, a continuation of the bounce is likely. IBD still sees market in correction.
15th day of $QQQ short term down-trend
Nice to be on the sidelines in cash. No one knows when this decline will end.