Have you noticed that when earnings are released, stocks often have large moves up or down. After the earnings report period, stocks tend to settle down until the the next quarter’s earnings begin again. August and September tend to be weak months in the market. I expect at the end of the current quarter, around October, we could see the end of market weakness. Remember the maxim, Sell in May And Go Away And Come Back at Halloween. We have seen some rapid selling in the leaders. It is possible that the QQQ short term up-trend will end on Thursday, after 81 days. This is one of the longer QQQ short term up-trends I have seen. So it is not unexpected that it could end soon. But the end of a short term up-trend does not necessarily mean a large decline is coming. Almost half of new short term down-trends end within 5 days. So, I wait, mainly in cash, to see how this will all play out. I try not to marry a scenario. I just respond to the market’s actions and signals. I can reverse on a dime.
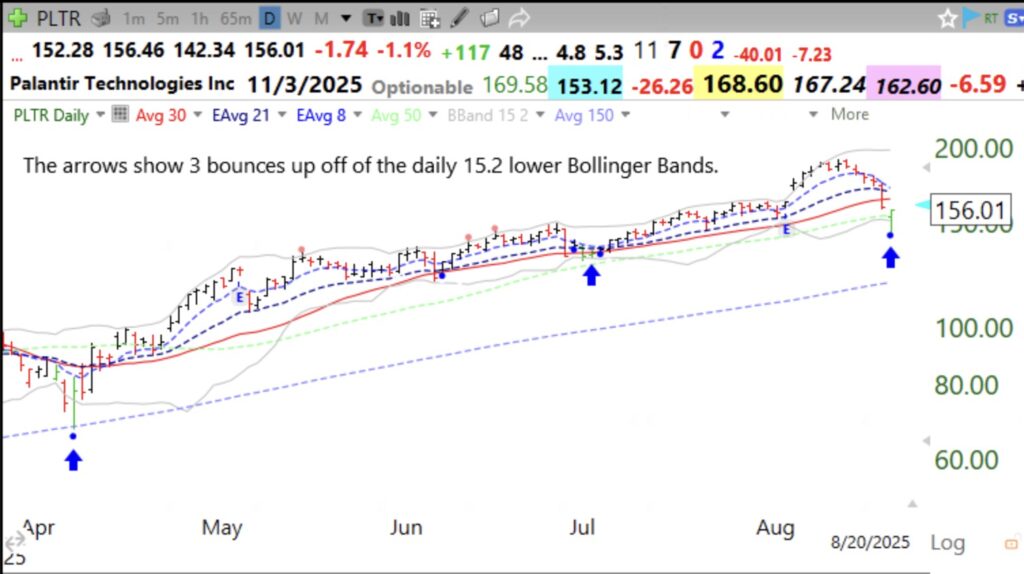
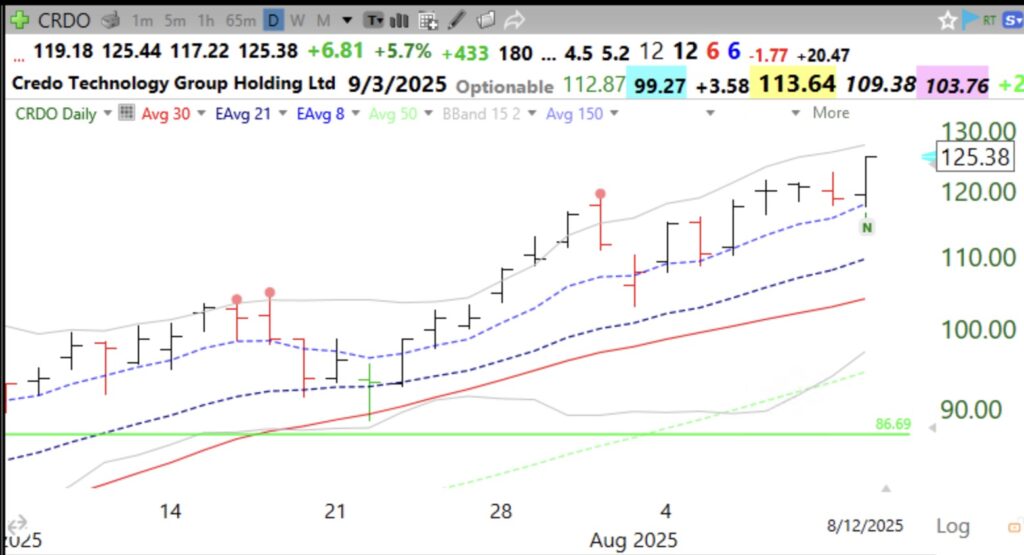
Many stocks bounced up off of their lower 15.2 Bollinger Bands on Wednesday (PLTR, AGX, FIX, IBKR, RMBS, to name a few). Tomorrow will tell if these bounces hold. Look at this chart of PLTR, as an example. The arrows show three prior such bounces. Note that each time the stock closed near its daily high on the day of the bounce. Will this bounce hold? We will know tomorrow. If the QQQ short term up-trend ends Thursday, I suspect many of these bounces will fail. I did not play this bounce. But if I had nibbled at PLTR today, I would have placed a stop loss just below the day’s low. Note the blue dot signals at each bounce. I explained the Blue Dot of Happiness indicator during my recent TraderLion Conference speech.