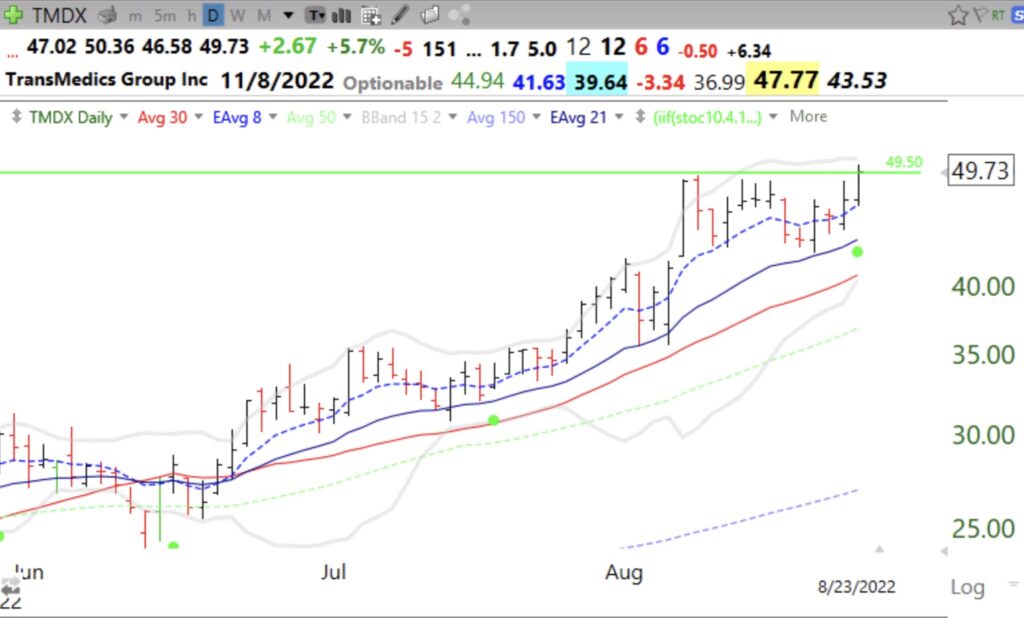
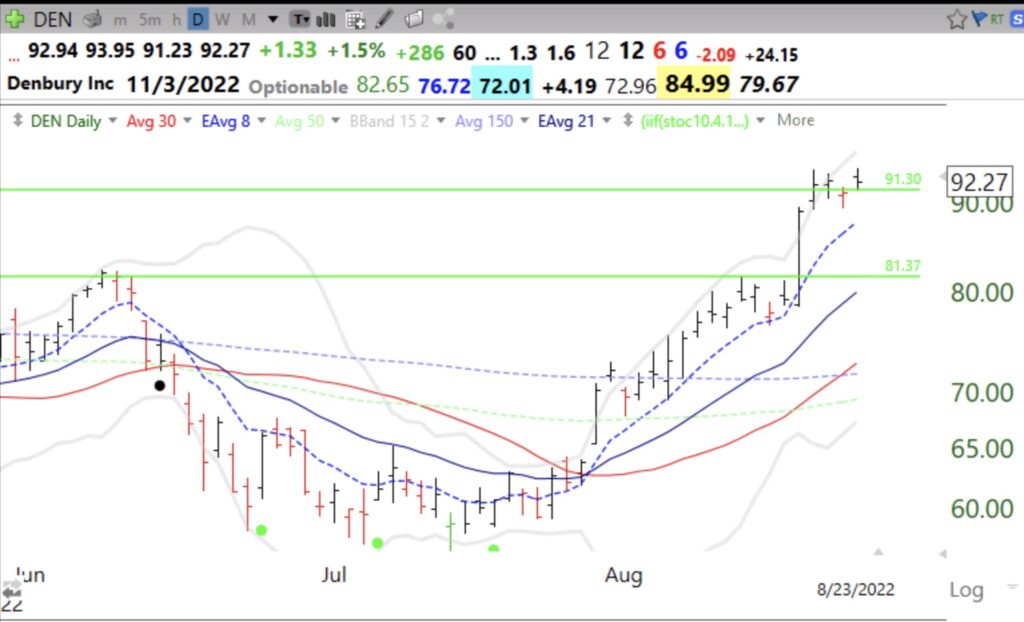
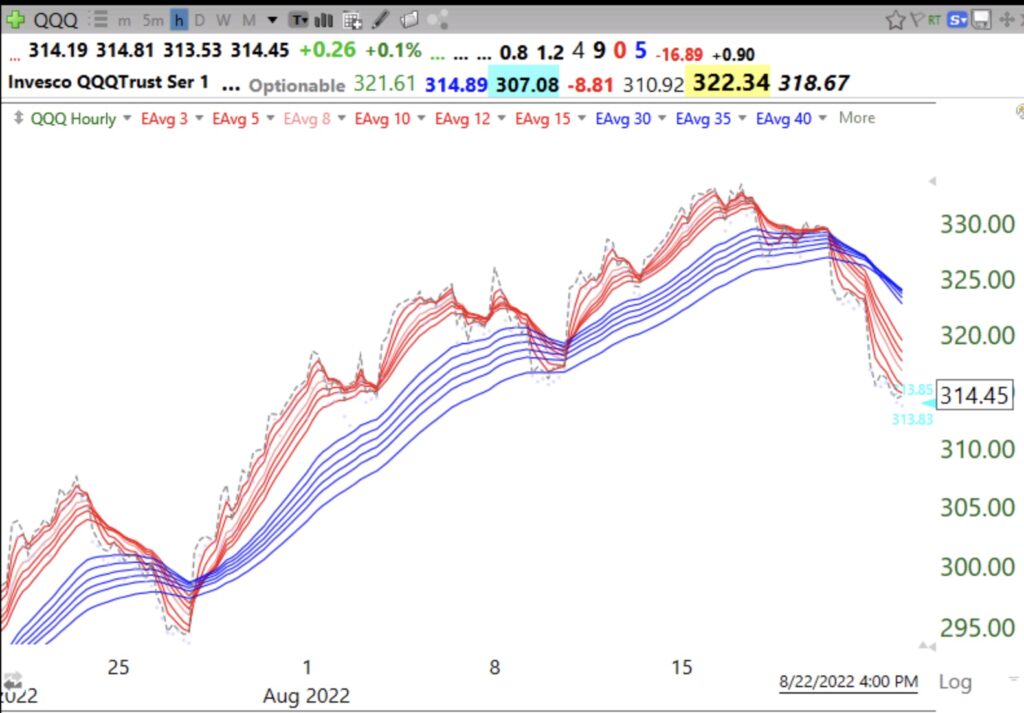
QQQ reached very oversold levels yesterday last seen in June before the recent rally began. 53% of NASDAQ100 stocks had a daily 10.4 stochastic <20. Last June 16 at the bottom, 85% traded that oversold. Since June 24 only one day had more than 10% of NASDAQ100 stocks with such the stochastic<20. The GMI remains Green and the QQQ short term up-trend remains intact for now. However, a few more declines in QQQ could end the short term up-trend. With the futures up this morning, we may get an oversold bounce.
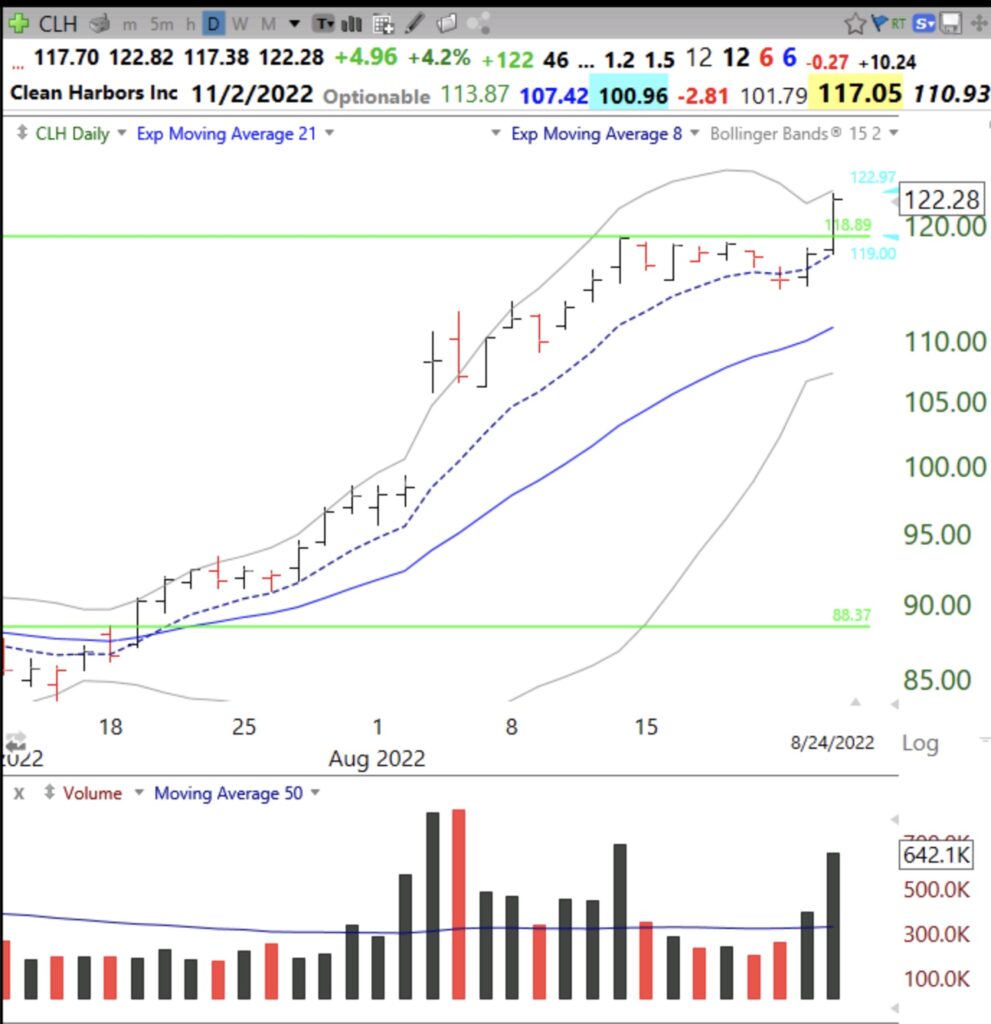
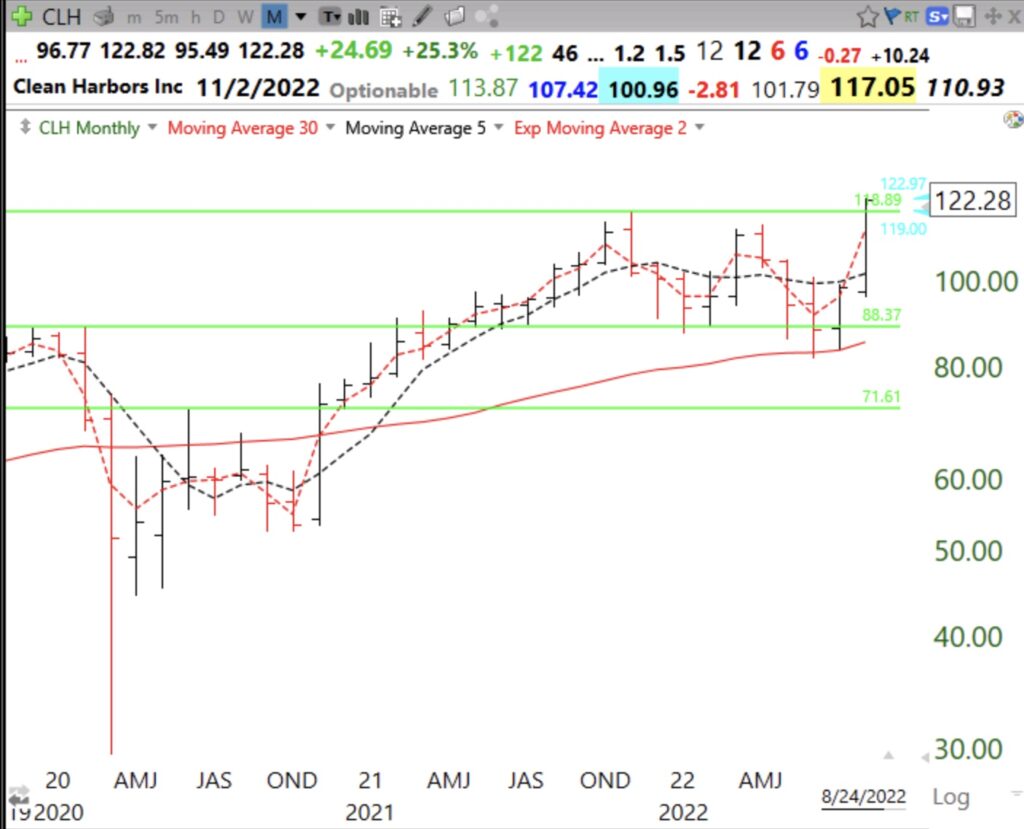
I had noticed a few days ago that CLH, a stock brought to my attention years ago by my stock buddy, Judy, was approaching a GLB at $118.89. How could I buy it if it traded through that price without being glued to my monitor? Nicolas Darvas had the answer. He was busy dancing around the world as he made 2 million dollars ($20 million in today’s dollars) in 18 months in the late 1950s. His classic book is listed at the end of this blog. Because Darvas could not spend his time following his stocks with his broker, he had no personal computers, he used buy stop orders. Once he had figured out a possible break-out price he had his broker enter a good til cancelled buy stop order. This meant that as soon as the stock traded at the price he specified his order to buy shares was entered as a market order. Darvas said that the buy stop order was a critical tool for him.
A buy stop order is potentially dangerous because it normally tiggers a market order to buy. If the stock opens up way above the stop price one would have to buy it at the higher price. I trade in my IRA and my broker does not allow buy stop orders in that type of account. Instead I can order a safer buy stop limit order. A few days ago I entered an order to buy CLH on stop at 118.95, limit 120. That way I will not buy it above 120. It was executed automatically at 119 and closed the day at $122.27. I now have to decide where I will exit if the GLB fails. (I could also have entered a stop loss order to be executed automatically once the buy stop limit order had been executed.) Be careful, because once one buys the stock it could reverse down quickly and be stuck with a loss. So it is good to monitor one’s executed trades sometime during the day. Darvas probably would have done so if he had a hand held computer back then. Here are daily and monthly charts for CLH.
