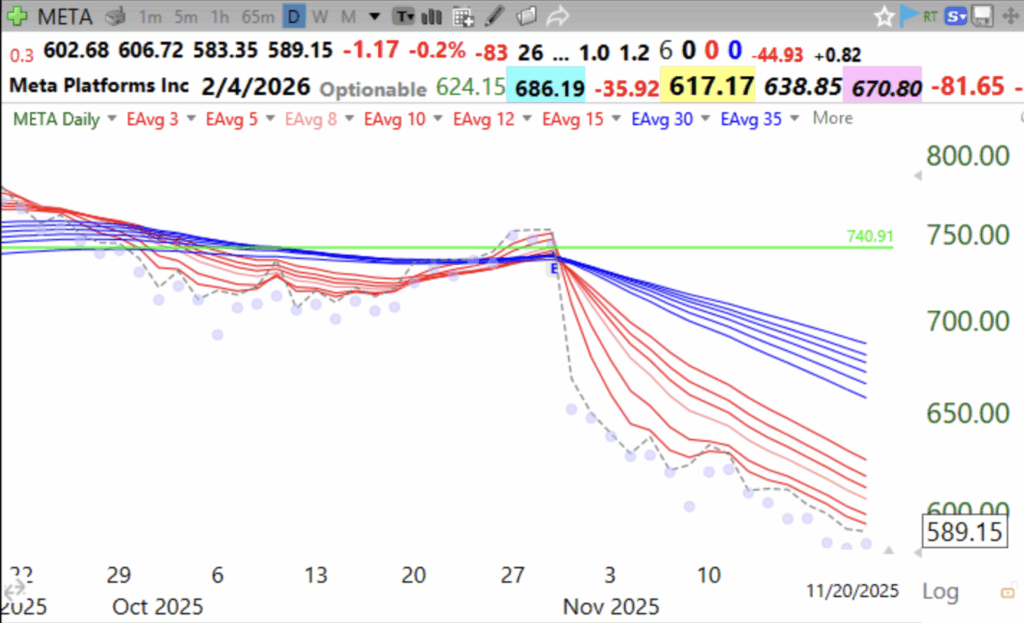
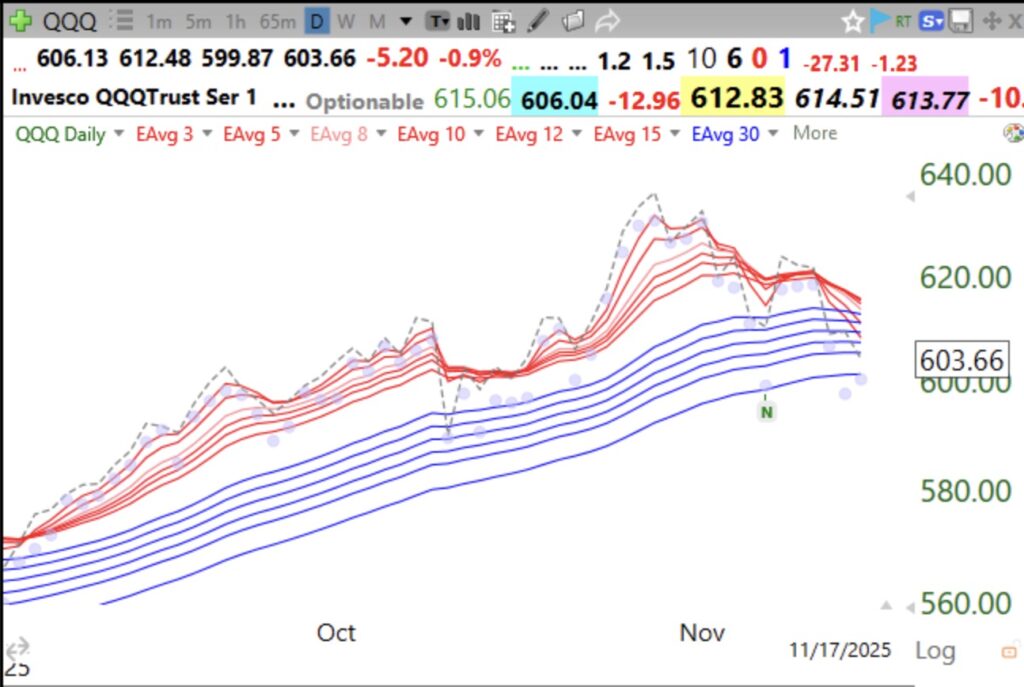
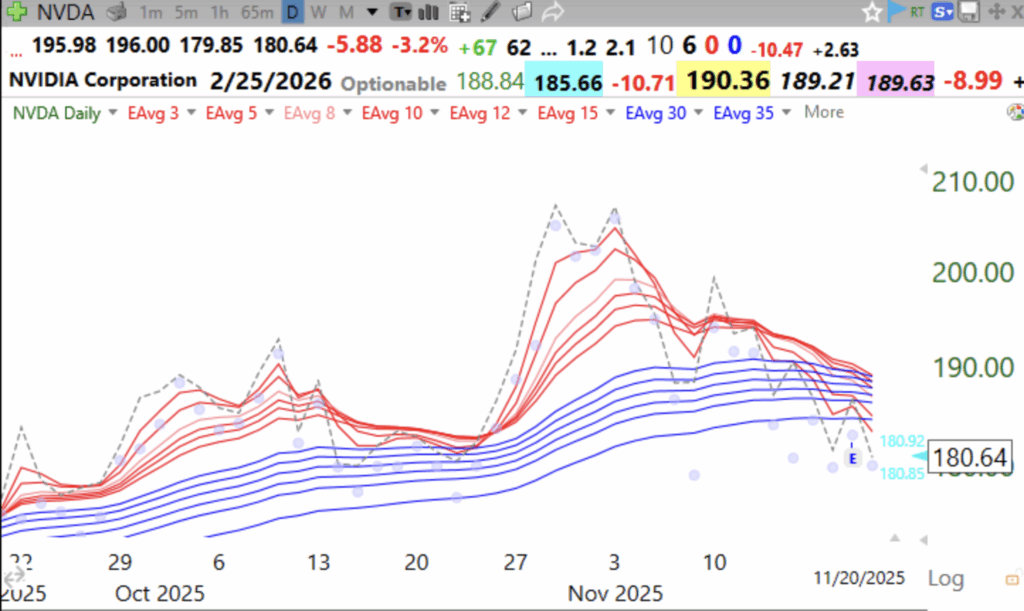
NVDA’s short term averages (red) have now converged with their longer term averages (blue). Below is the daily modified Guppy chart for NVDA. The dotted line shows the daily closes.If the red lines decline below all of the red lines, it will be a BWR down-trend (see chart of META below) and very ominous. Regarding the weakening ETF, QQQ, I am accumulating the 3x leveraged inverse ETF, SQQQ, which rises 3x more than QQQ declines. I am mainly in SQQQ in my trading accounts. The longer term trends remain up so I have not yet exited the mutual funds in my retirement accounts. But market indexes, and especially their equal weighted equivalents (QQQE, RSP), look much weaker. This means that the smaller companies, which are masked by the large cap tech stocks in the weighted indexes, are much weaker.
This is a daily BWR down-trend.