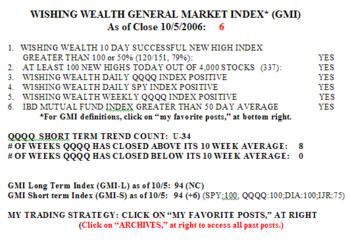
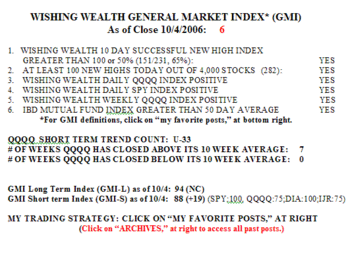
The GMI closed at 6 and the GMI-S rose to 100. Thus all of my short term indicators for four index ETF’s (DIA, QQQQ, SPY, IJR) are positive. The market weakened on Friday with only 30-37% of the stocks in the Nasdaq 100, S&P500 and Dow 30 indexes rising. 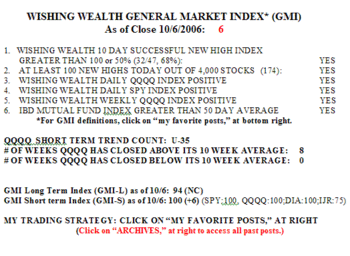 Nevertheless, 72% of the stocks in my universe of 4,000 closed above their 10 week averages. The QQQQ is now in its 35th day of an up-trend. If I had been listening to the media pundits, I would have missed this delicious rally. Remember, the go away in May crowd returns around November. Most market gains come between November and April. So why are so many market pundits bearish. Did you note that several days ago when the market had a decline the put/call ratio hit 1.07. Usually people become that bearish after a long decline. To find higher volume in puts than calls shows how skeptical traders are of this market rally. Remember, option traders usually bet on the wrong side of the market.
I am introducing a new table on the performance of the IBD 100. So many readers come to my blog because they are interested in this list that IBD publishes each Monday, containing the strongest stocks, according to their CAN SLIM technique. While I like the CAN SLIM technique, I think that IBD overstates the perfomance of the IBD 100 stocks when it compares its IBD 100 Index to the S&P 500 Index. IBD replaces poor performing stocks in the list each week with stronger stocks, thus biasing the results towards only stocks that do well. In contrast, the S&P 500 index stocks change very infrequently. So, the most valid way to look at the performance of the IBD 100 stocks is to look at how each individual list does over time. This table shows that for the lists published on 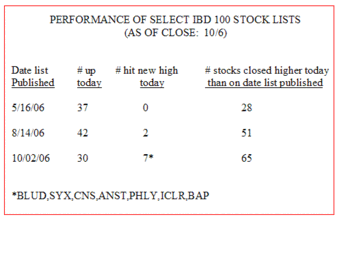 5/16, 8/14, and 10/02. It is interesting that only 30% of the stocks on the list published last Monday rose on Friday. Furthermore only 65% of the stocks from 10/02 closed higher on Friday than they closed on the Friday just before the list was published. The lists from 8/14 and 5/16 did much worse, with only 51% or 28% closing higher on Friday than on the date the list was originally published. There were seven new yearly highs in the list from last Monday, and they are listed in the table. Let me know if you want me to continue to update this table…..
RIMM is an interesting stock. It gapped up on 9/29 when it raised its guidance for future sales and earnings. 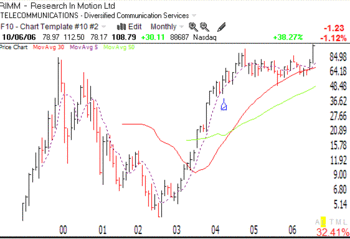 I thought I had missed the stock. But when I looked at its monthly chart I could see that RIMM has blasted out of a 21 month long consolidation and I bought some. RIMM may be just begining its up-trend…..
Another stock that I think may be starting a run is GOOG. It has been consolidating since last January and forming what looks like a triangle. After a few false starts, GOOG may have broken out last week, and I bought some. 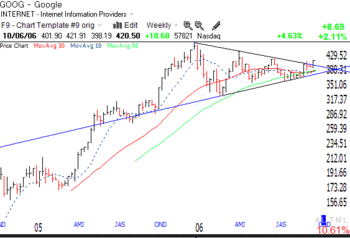
Please send your comments to: silentknight@wishingwealthblog.com.
