The GMI is 5 (of 6) and the more sensitive GMI-R is back to 9 (of 10). The relatively weak major stock averages do not tell Monday’s story. Leading stocks like AAPL, AMZN, NFLX, and PCLN had terrific days. The new QQQQ up-trend is now in its 2nd day. I am more certain of a new short term trend if it can reach 5 days. For now, however, with the longer term up-trend intact, this is a good time for me to buy leading stocks that recently became oversold and are now rebounding………
My IRA account is now near its all-time high, having increased 15x since 1995. My margin account has doubled since earlier this year. The GMI has kept me on the right side of the market. Half of the key to investing success is to just follow the trend of the overall market. My university pension remains 100% long in mutual funds. I rarely move out of these funds into money market funds. But by following the GMI, I remained safely in cash during the 2000-2002 and 2008 market declines……..
For quite a while, I have shown how the 3X technology ETF, TYH, outperforms the QQQQ, and virtually all stocks, during an up-trend. I did not know that a 3X ETF exists for the QQQQ. Apparently, UltaPro created one last February. TQQQ is designed to track the QQQQ by 300%. Since the QQQQ rallied on September 7 (+15.8%), the TQQQ increased +54.4%, while TYH advanced only +49.2%. The comparable inverse ETF for QQQQ is SQQQ, which goes up as the QQQQ declines. Other 3X ETF’s from UltraPro are: URTY, UMDD, UPRO, UDOW, SPXU, SDOW, SMDD, and SRTY………..
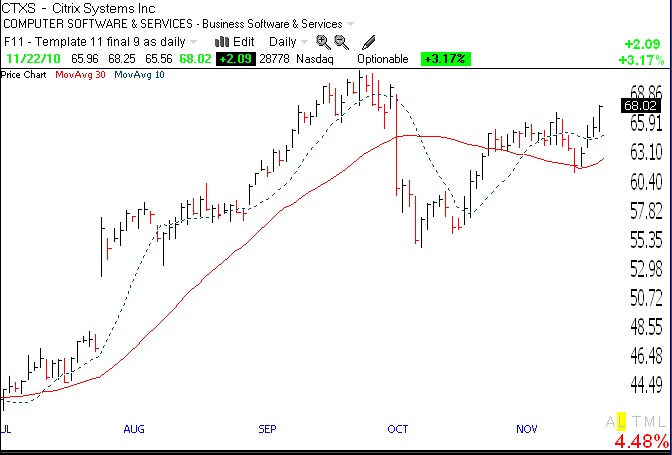
I bought a little CTXS on Monday. Judy told me about this stock long ago and I have been watching it for an entry. This chart looks like a cup-with-handle pattern (click on chart to enlarge), but I am concerned that there was no increase in volume as it broke above its handle. If it starts to slip, I will sell out.
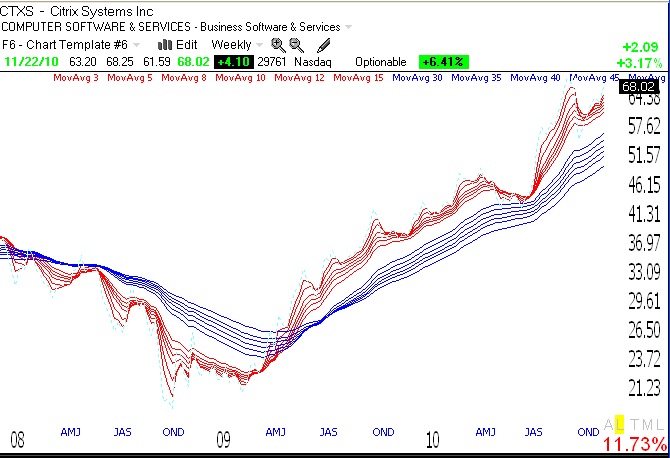
CTXS is also a RWB rocket stock, as shown by the weekly GMMA chart below. All of the short term averages (red) are well above the rising longer term averages (blue).