AAPL continues to weaken–an ominous sign for the market.
Stock Market Technical Indicators & Analysis
AAPL continues to weaken–an ominous sign for the market.
The expected bounce from oversold has begun. There were 657 new lows on Monday and 58% of the Nasdaq 100 stocks hit a very oversold level.
With the major indexes so oversold, it is very possible that they will bounce on Monday. IBD reports that the put/call ratio was 1.19 on Friday, showing extreme bearishness among option traders, and at a level at which bounces typically occur. Given the Fed meeting this week, we could get a situation where people have already exhausted their selling in anticipation of a rate hike, and they decide to buy on the news. I am not in the prediction business, however, and will wait for the market to show its hand. What I would not do is to begin selling or shorting on Monday. Such actions may be preferable for me after the next bounce.
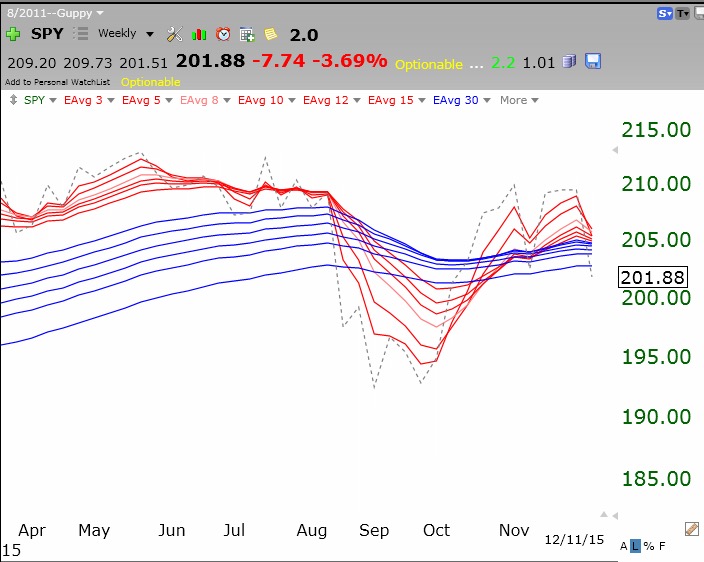
This GMMA weekly chart shows that the RWB pattern is gone and the rebound from the summer decline may have ended. The SPY (dotted line) has now closed below all 12 of its moving averages. If the summer decline was the first leg down of a bear market, the next leg could be major.
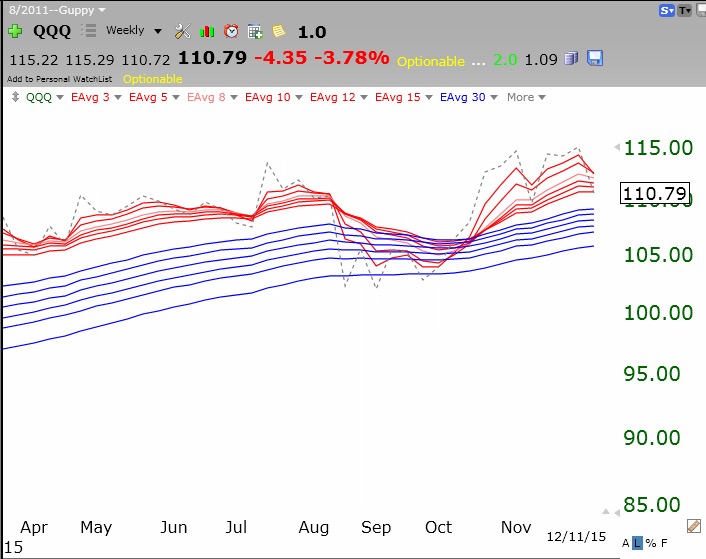
But the QQQ, composed of nonfinancials and tech stocks, looks much stronger and remains in an RWB pattern.
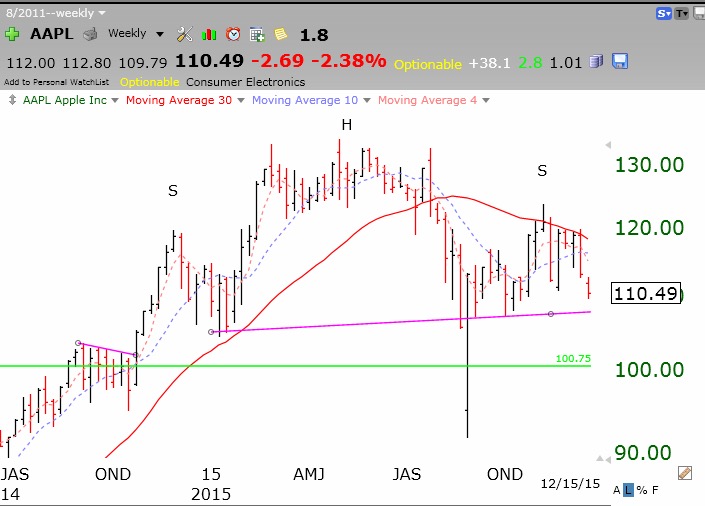
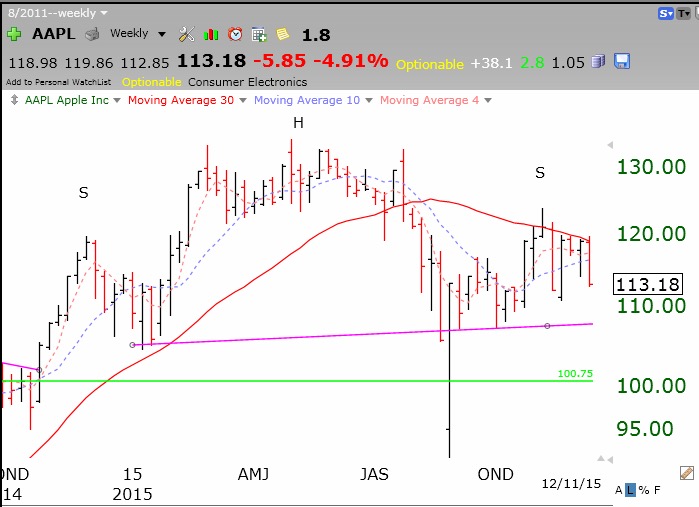
 Nevertheless, the AAPL head and shoulders top pattern I have been writing about appears to still be possible. Note the resistance at the declining 30 week average (red line). Stage IV decline anyone?
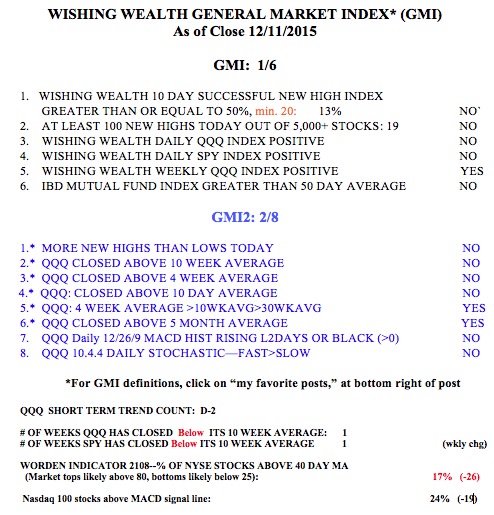
The GMI remains on a Sell signal. The SPY and QQQ have now closed below their critical 10 week averages.