The stocks I follow have moved up so fast lately that I am worried. This usually happens at tops.
 Dr. Wish
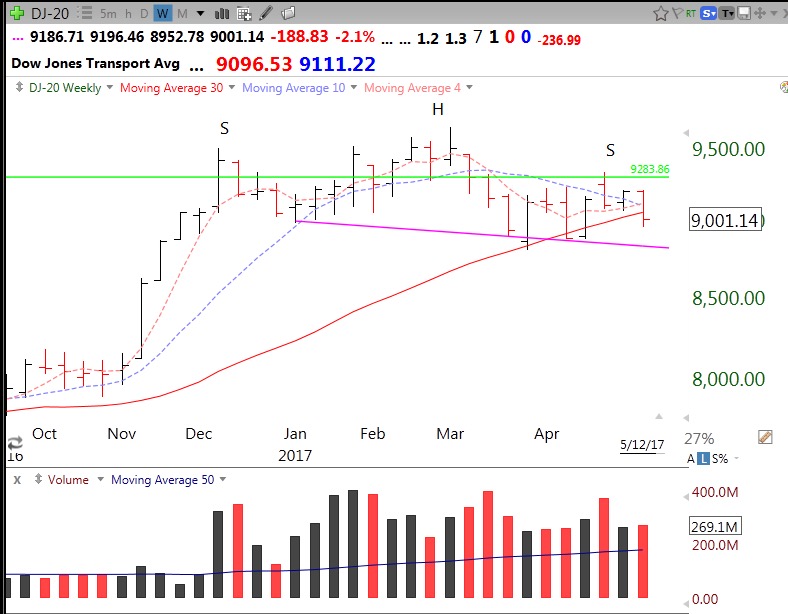
Is the Dow Transportation Average projecting market weakness?
Dow Theory is a famous system for diagnosing the market’s trend. One of its two components, the Rail or Transportation Index, seems to be showing a possible head and shoulders top pattern. While in this digital oriented economy, the transports may have lost their importance as an indicator of economic activity, a lot of goods and commodities are still moved by train and plane. While the growth tech stocks are still going strong, the weakness in this transportation index may bear watching. Here is the weekly chart of the Dow 20 stocks.The index is down 7 of the last 10 weeks with some large declines coming with volume spikes. It has closed below the six red and and six blue line daily RWB averages, not shown (0/0) The index has now closed back below its critical 30 week average (red line). We need to watch the neckline (purple line). A close below this line might be a sign of significant weakness.
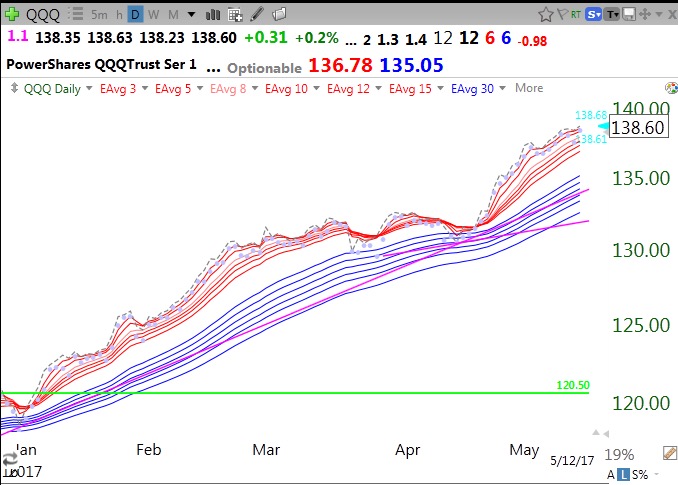
Meanwhile, the QQQ still looks strong in this daily RWB chart (12/12/6/6).
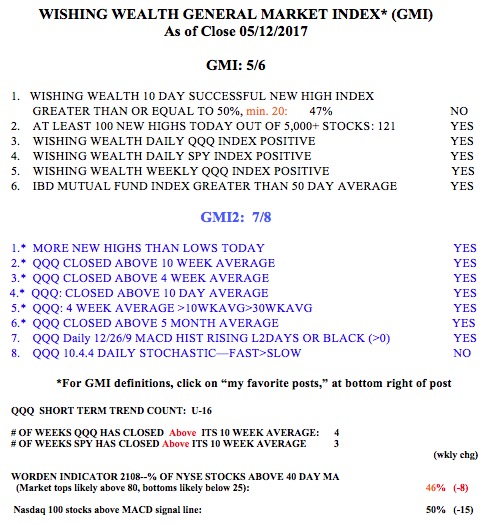
The GMI is now 5 (of 6) and Green.