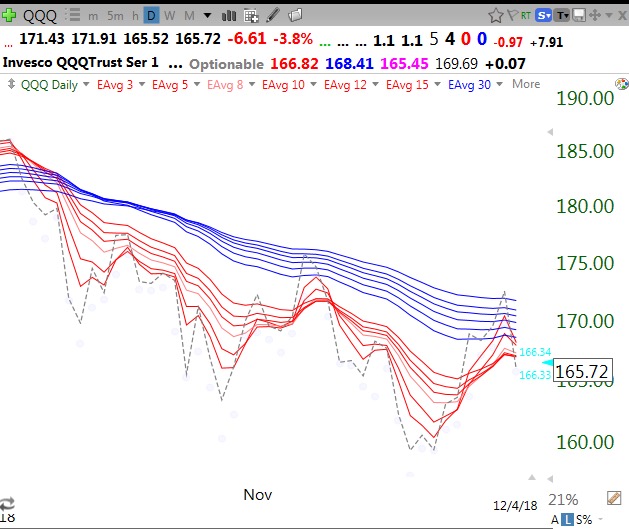
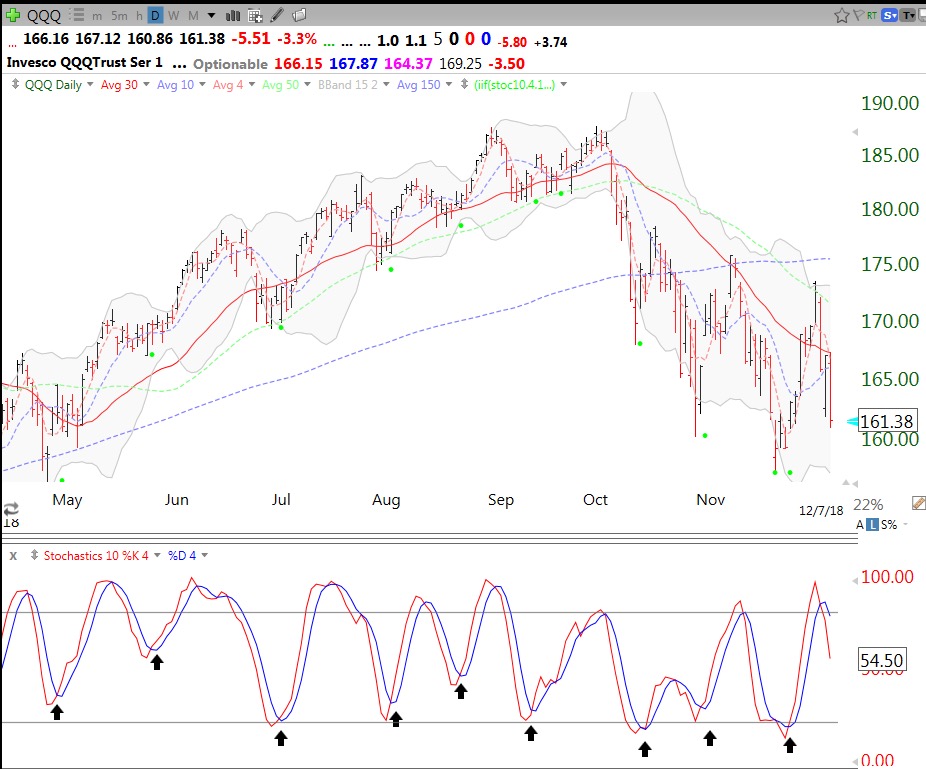
If you listen to the media hype, you would think we had experienced a huge decline thus far. However, if you look at longer term trends, the current decline is quite puny. First, let’s look at the short term. My read of this daily chart of the QQQ is that short term bounces have occurred when you got a crossing of the daily 10.4 fast stochastic (red) above the slower 10.4.4 stochastics (blue). This “green dot signal” is shown on the price chart by the green dots. On the lower stochastics indicator chart it is shown by the black arrows. (In my TC2000 club there is a video tutorial showing how to add the green dot signals to charts.) Most of these cross overs have occurred with the fast stochastics (red line) below 50. While anything is possible, I think the next bounce will most likely occur from a much lower level. When the daily 10.4 stochastic declines to 20 or less, it is now 54.5, a quick several day bounce is more likely.
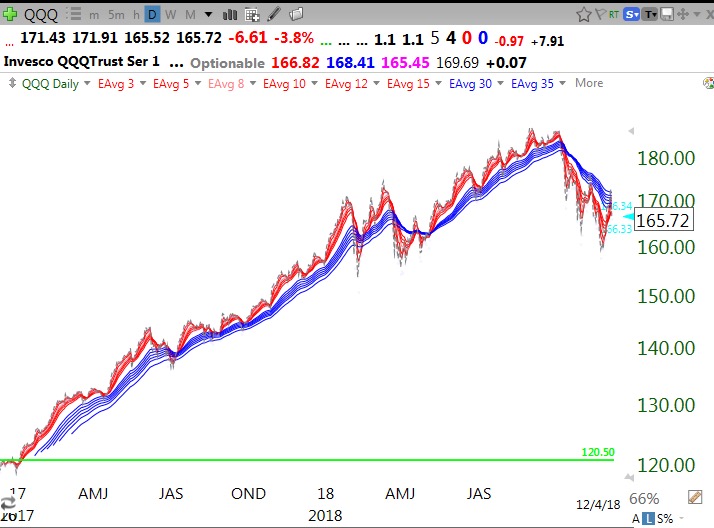
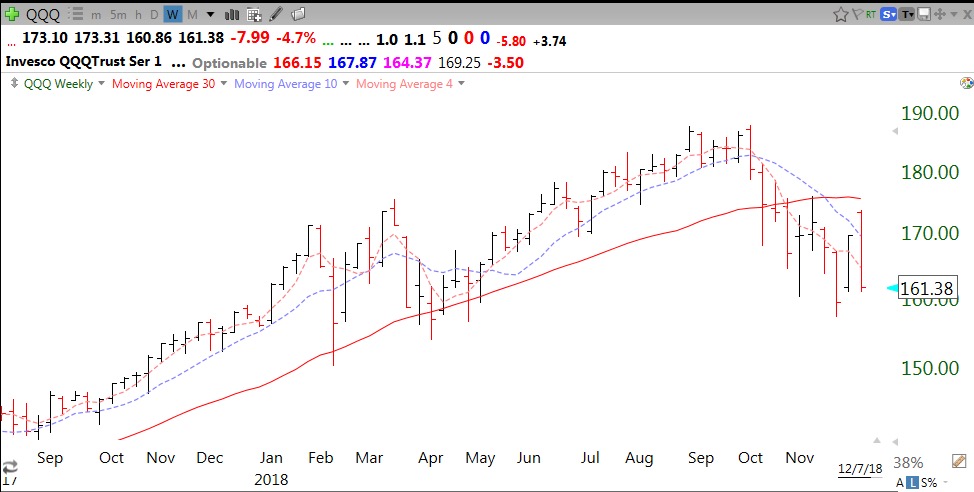
Moreover, the weekly chart of the QQQ is quite ominous. The QQQ has closed below its critical 30 week average for 8 straight weeks and the 30 week average (red line) is now curving down. If this decline in the 30 week average persists, it represents the beginning of a Weinstein Stage IV decline. At the 2000 and 2008 tops I got out of the market when the 30 week average turned down and I got out before the carnage. We may be at the very beginning of a major decline.
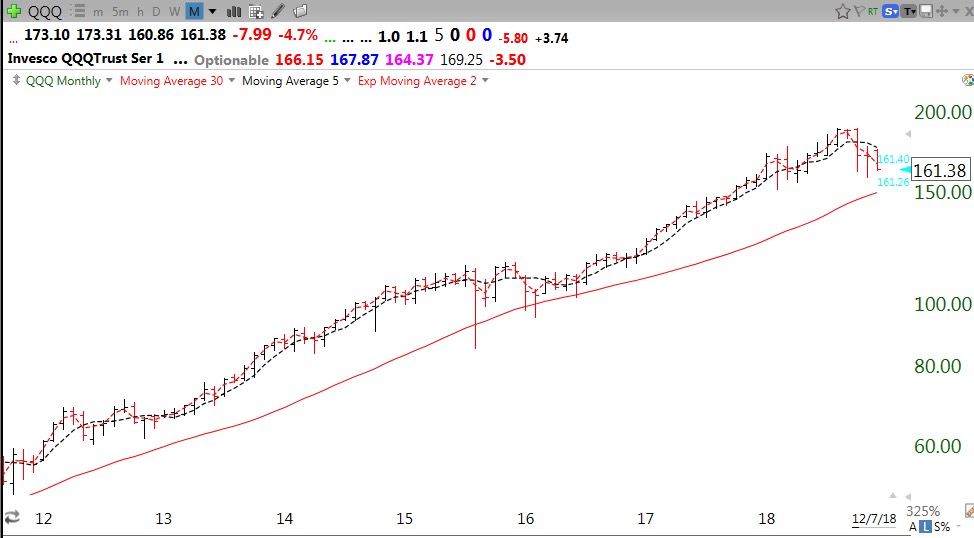
Finally, this monthly chart shows that this decline is quite small, thus far. It hasn’t even touched the 30 month moving average (red line)as it did in 2015/16.
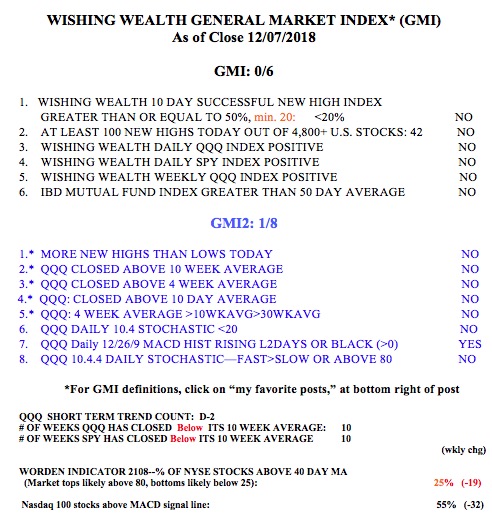
And the GMI=0, a very weak reading. This market is for gamblers.