The QQQ 10.4 daily stochastic is near oversold–bounce coming?
Stock Market Technical Indicators & Analysis
The QQQ 10.4 daily stochastic is near oversold–bounce coming?
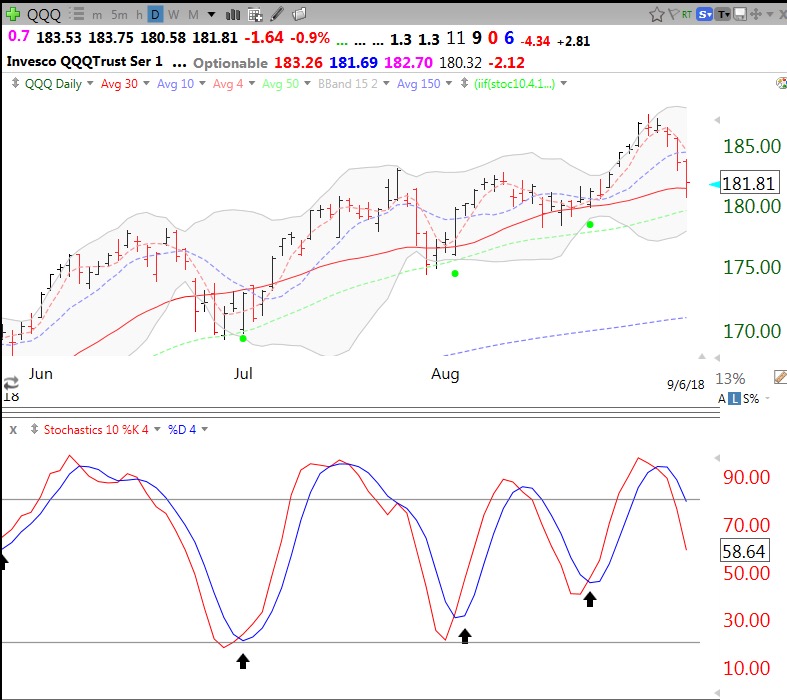
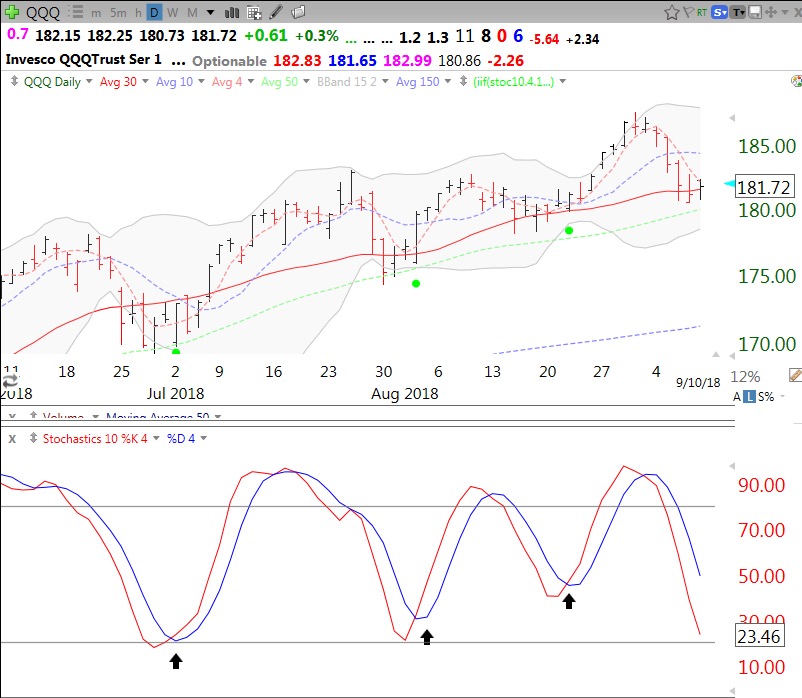
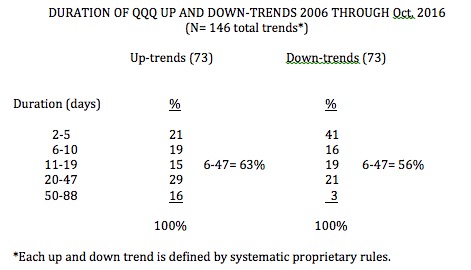
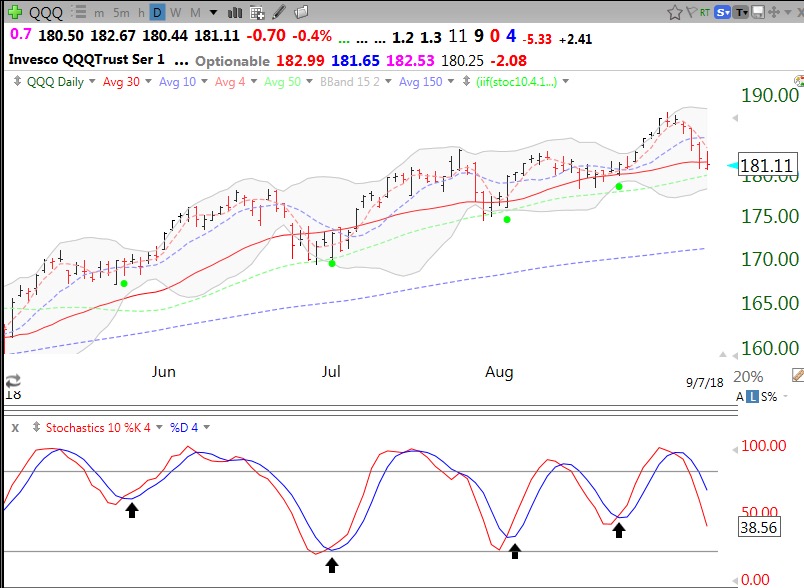
The current QQQ short term up-trend has lasted 44 days and could end on Monday. If it does, new QQQ short term down-trends often (41% of time) last less than 5 days. The QQQ daily 10.4 stochastic = 38.56 and is also low enough to bounce and could flash a green dot signal. But I would prefer that the stochastic reach a very oversold level, around 20, first. Must be patient and react after it happens and not anticipate the signal, however.
The GMI remains strong and suggests that the longer term up-trends are intact.
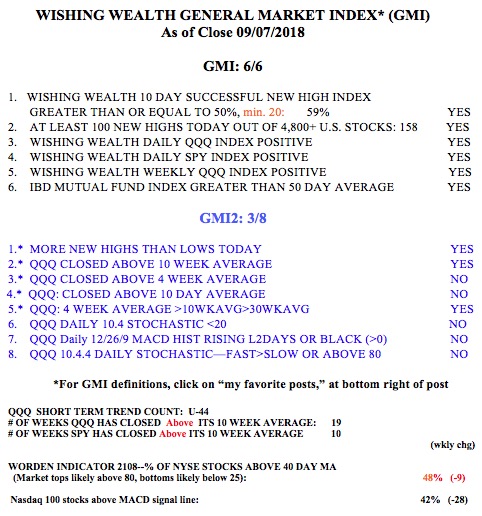
This decline is not over yet.