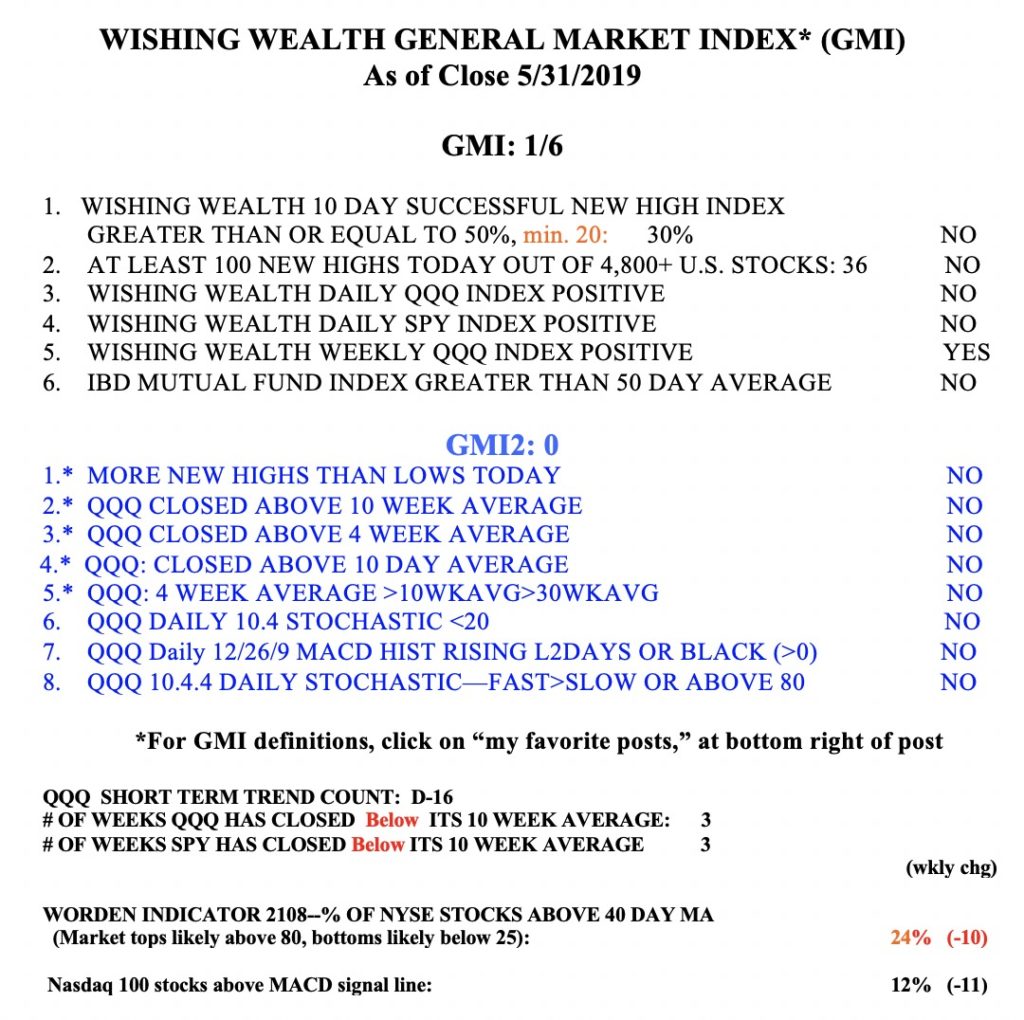
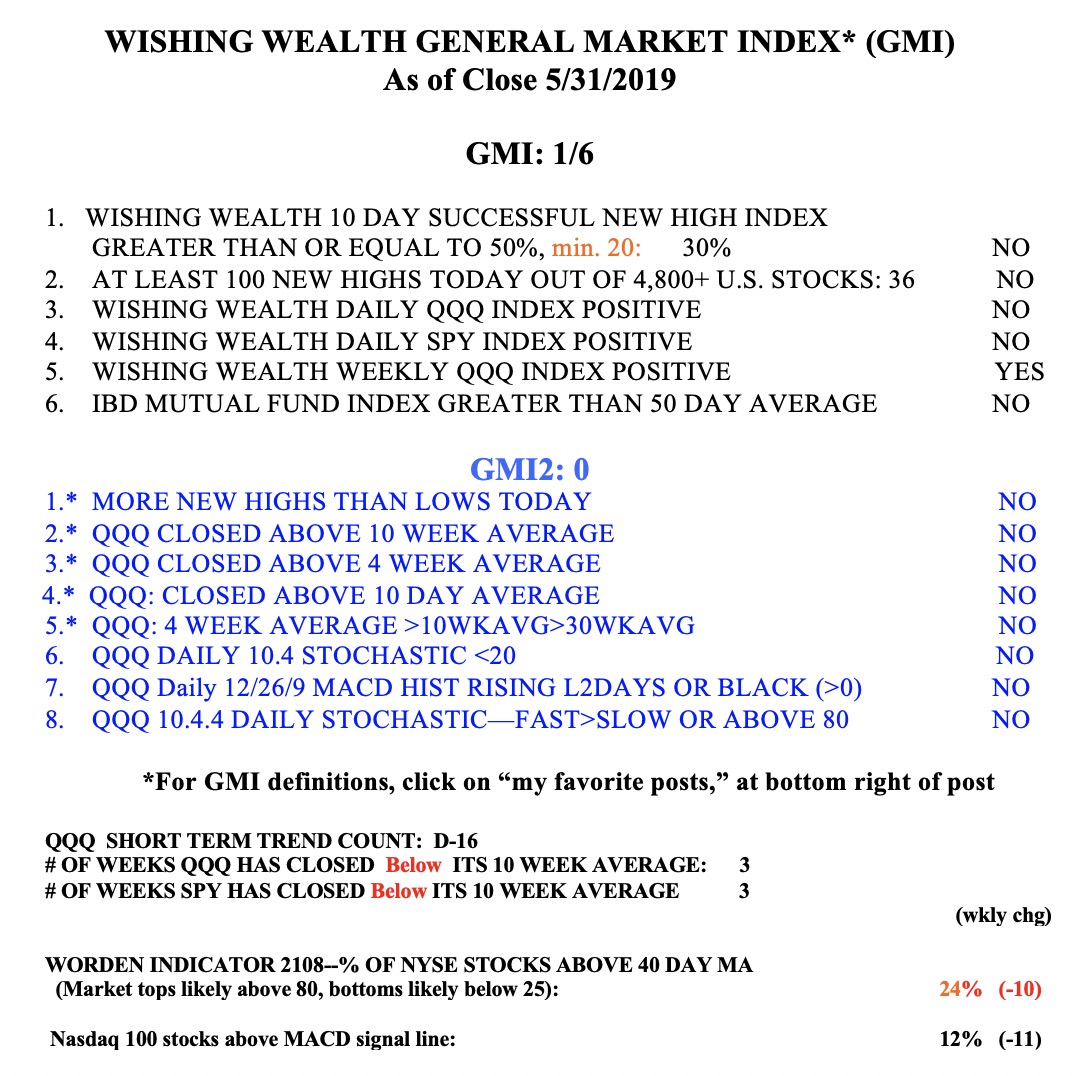
The general market is in a down-trend. When that happens, the rules for buying stocks on support that worked in the rising market fail miserably. One of the statistics I compute every night after the market has closed is the percentage of all stocks that reached a new high 10 days ago that have now closed above their price price 10 days ago (one of the components in the GMI, see table below). I focus on buying stocks at new highs and therefore want to make sure that stocks that do so are likely to rise. Since May 7, the percentage of about 4900 US stocks that were successful 10 day highs has been 50% or higher on only 5 days (only 30% did so last Friday). During this same period, my opposite, successful 10 day new low indicator, the percentage of stocks that hit a new low 10 days ago and closed lower than they did 10 days earlier has been 50% or more on 16 days, or all but one day Since May 7. Thus, if I had to trade stocks, I would have had a much better chance of making money if I shorted stocks at new lows or bought put options on them. Buying or holding stocks at or near new highs is now a losers game. Everyone must do some self-analysis to determine why they would do so during a market down-trend. Ask, do I want to make money or to be smart?
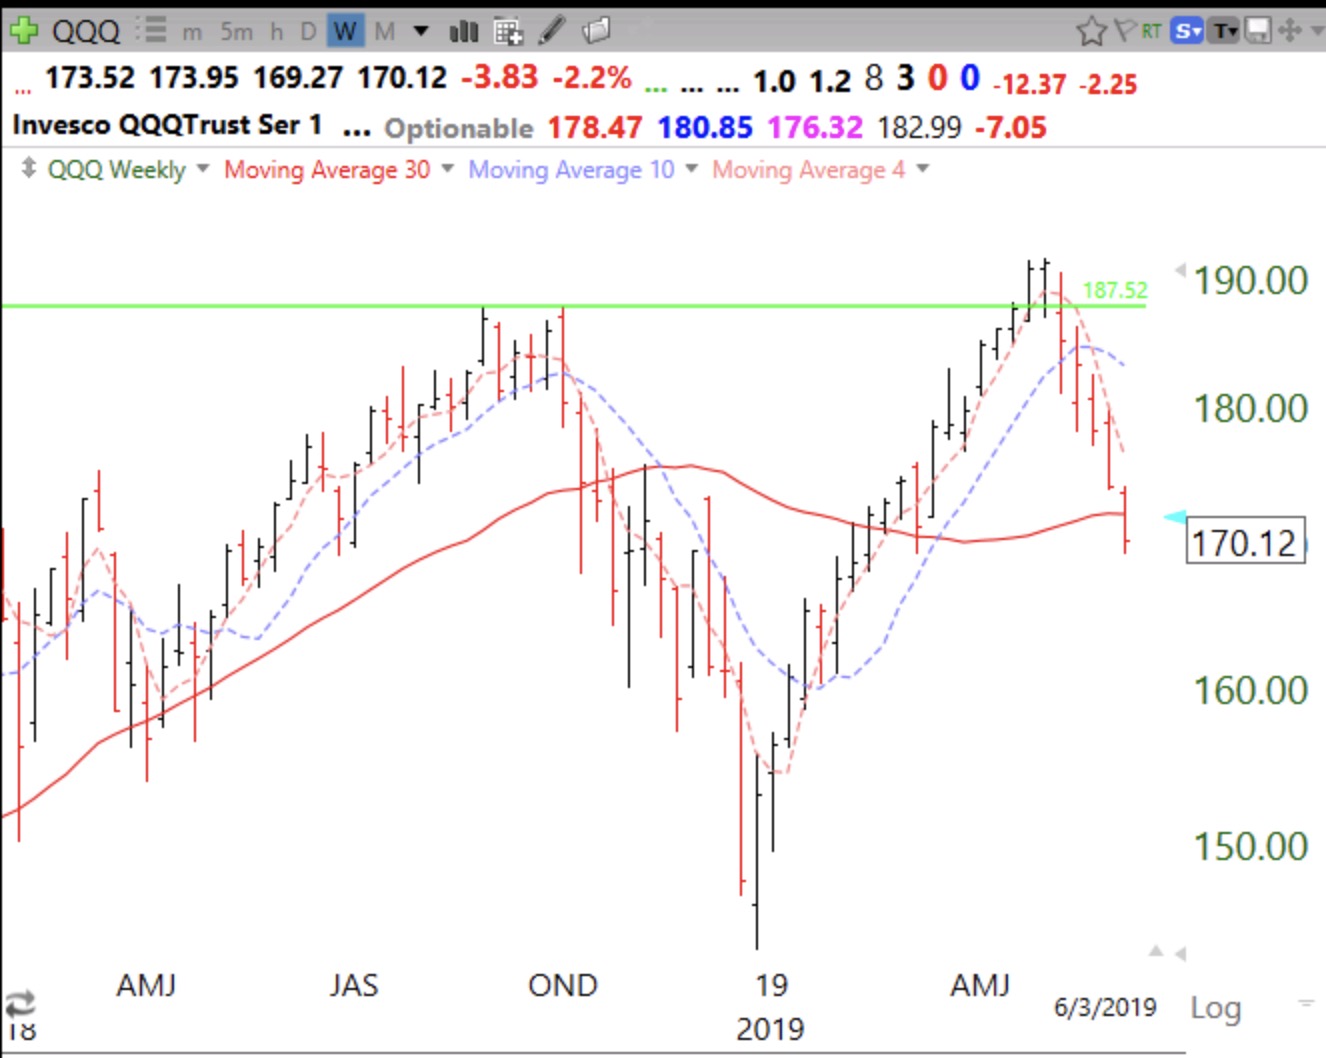
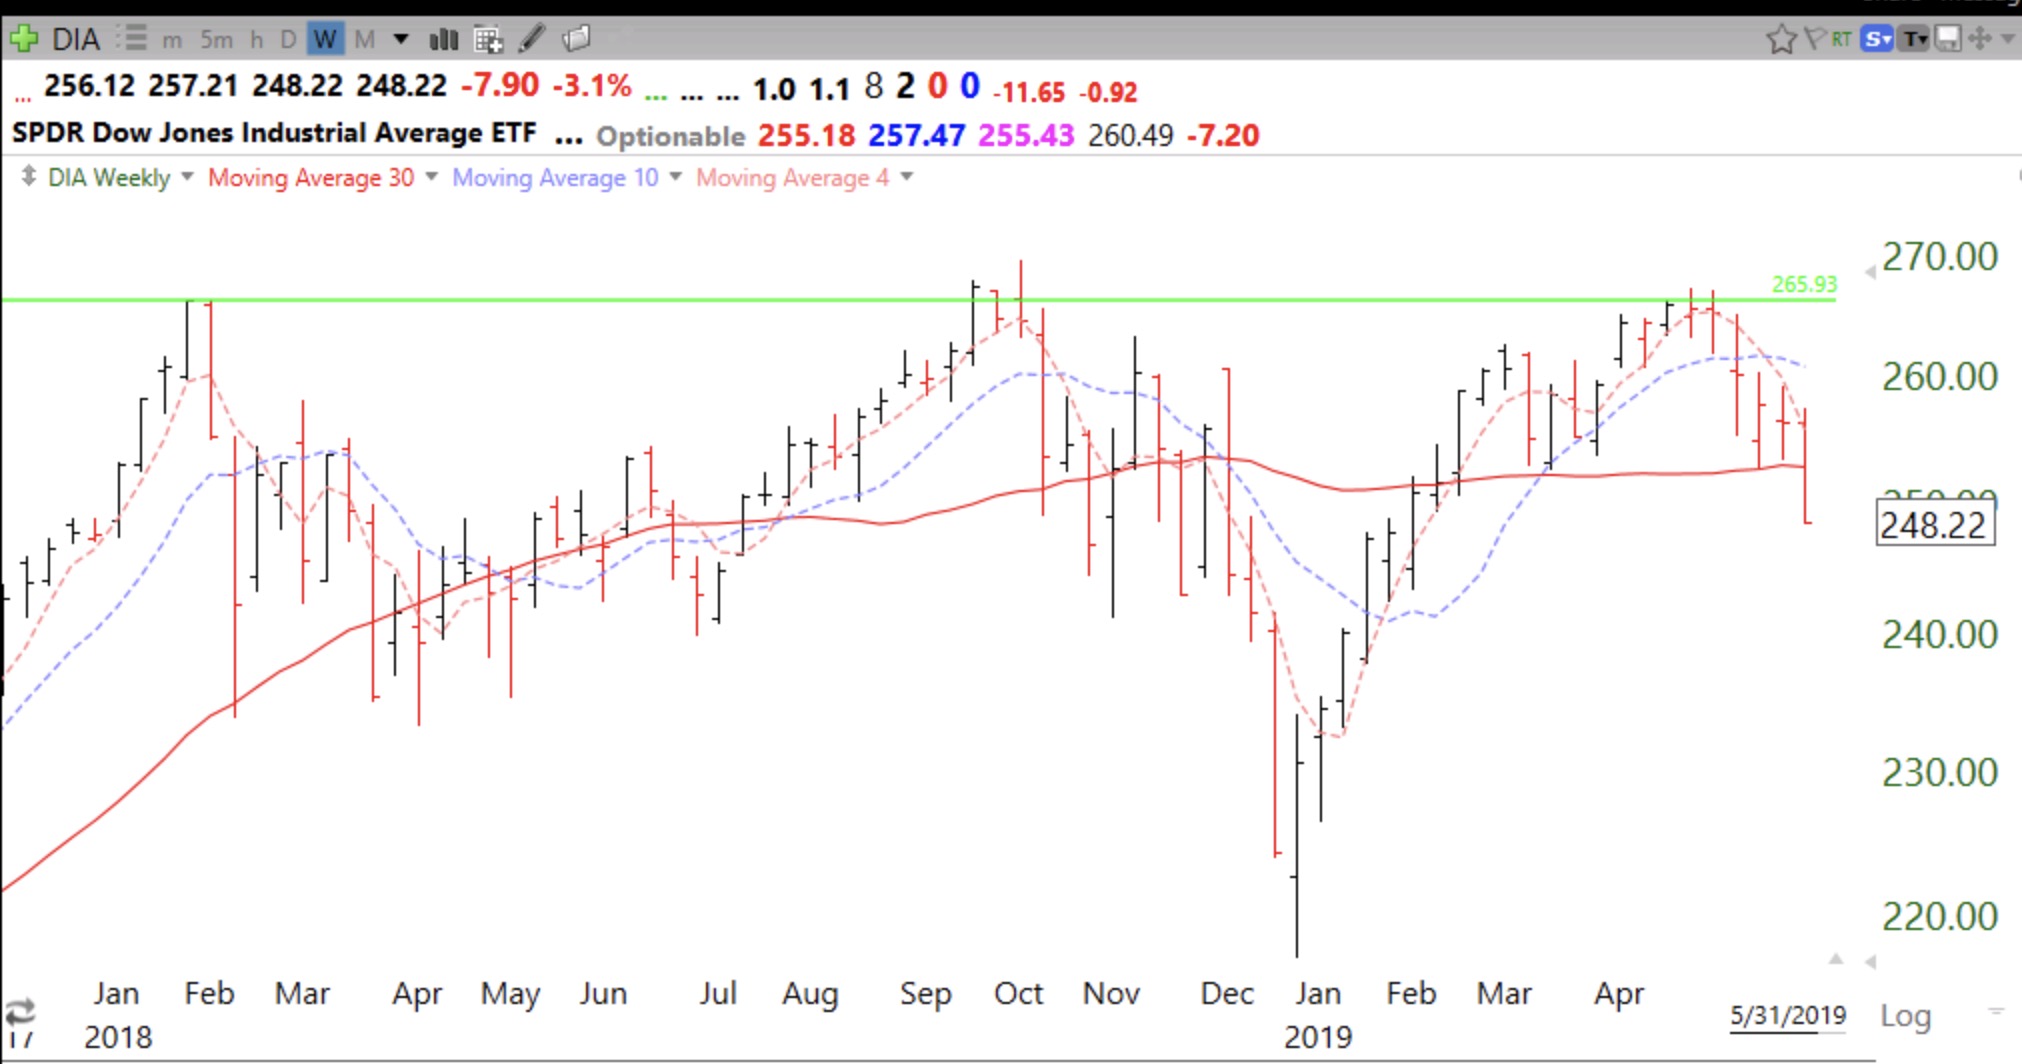
By the way, the Dow (DIA) is now back below its critical 30 week average (solid red line). This may be a triple top formation. If the 30 week average curves down, the market could be at major risk of a significant decline. That signal saved me from staying long during the 2000 and 2008 market debacles.

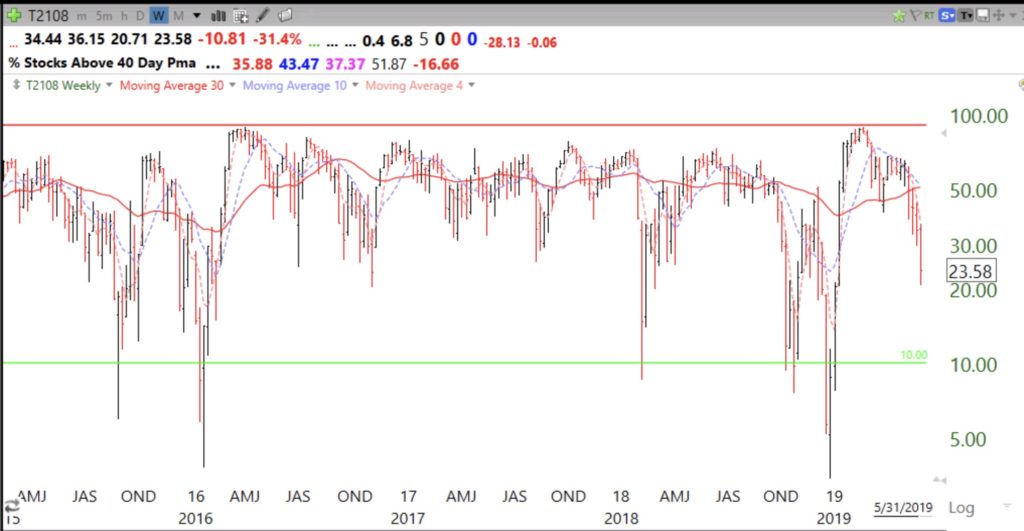
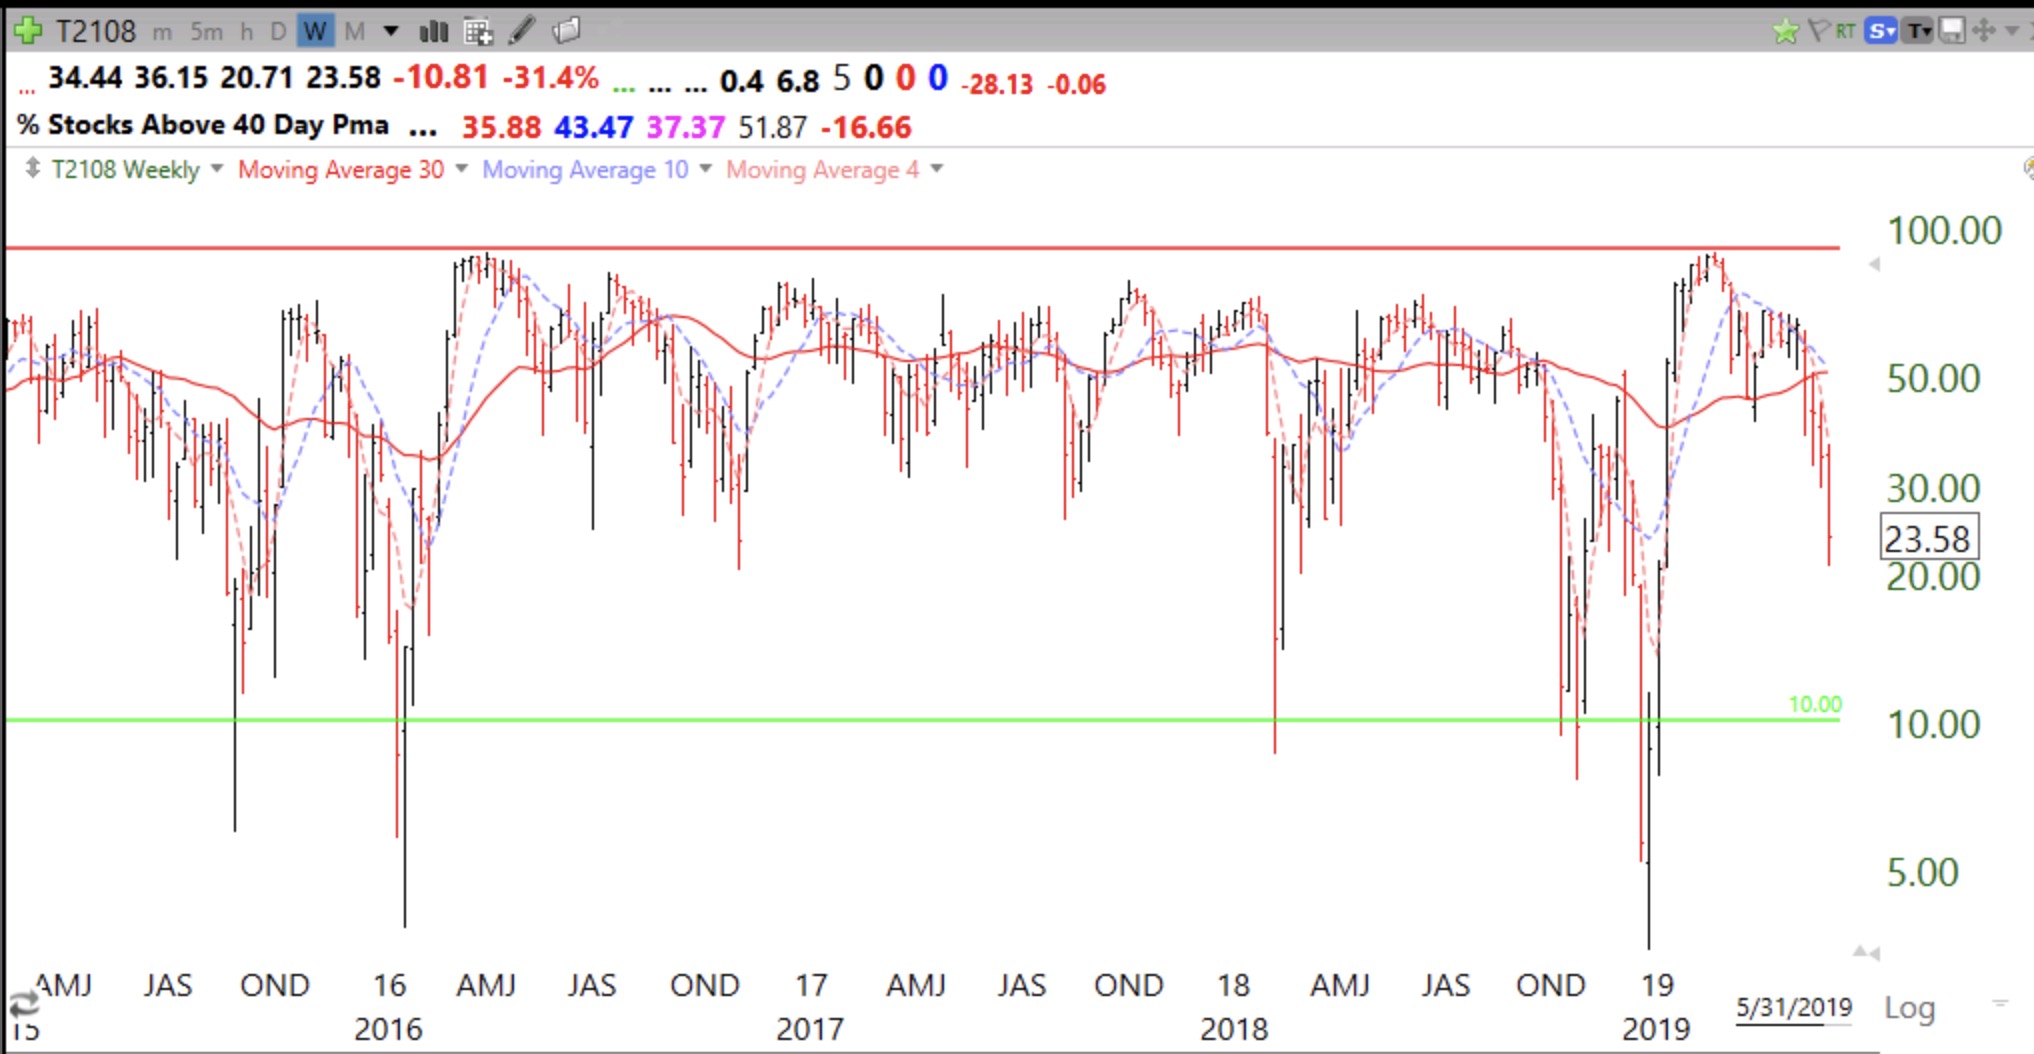
The GMI remains at 1 (of 6) and on a Red signal. The T2108, currently at 24%, typically falls below 10% at or near a market bottom.