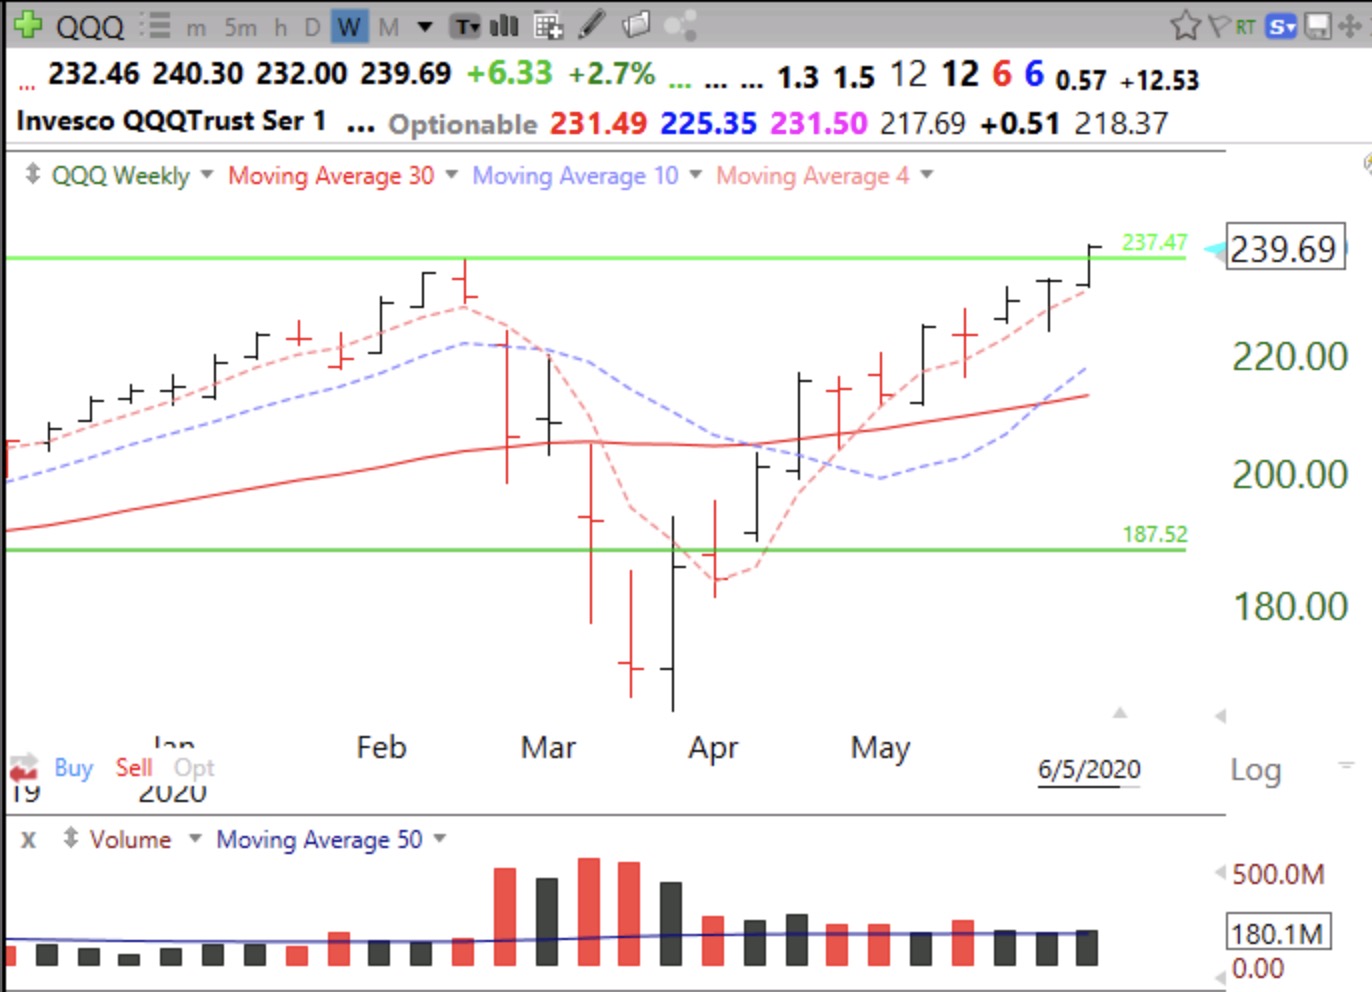
Friday was 42nd day of the $QQQ short term up-trend. T2108 is about as high as it gets, but does not signal tops, only bottoms. Very important that QQQ hold its green line, at 237.47. Note that QQQ has closed above its 4 week average (pink dotted line) for 10 straight weeks. A weekly close below that average could indicate weakening of this strong up-trend.
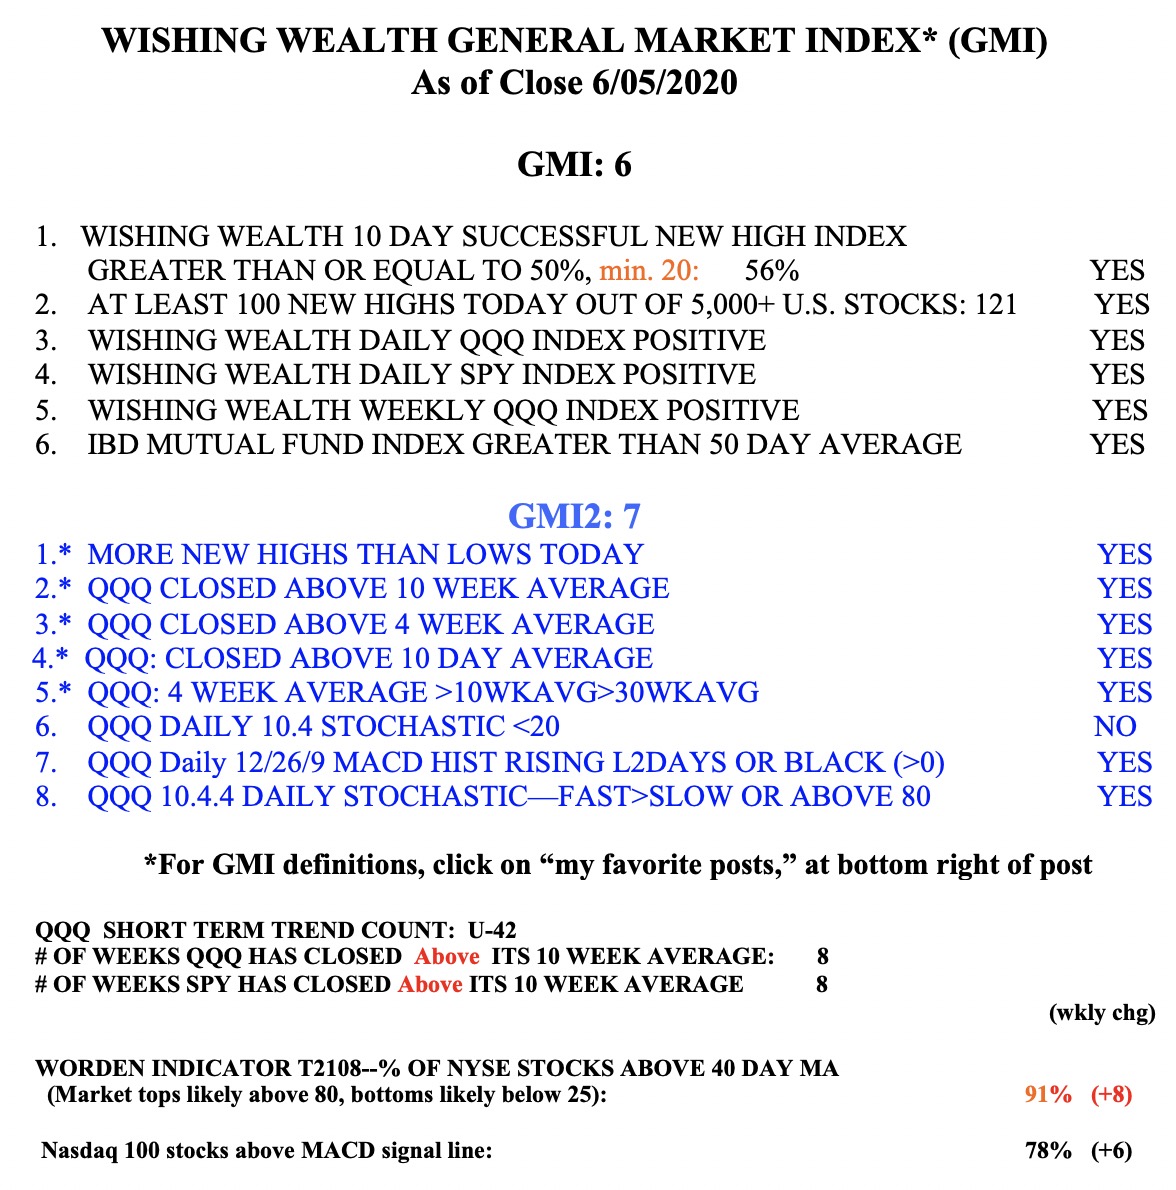
GMI remains Green and at 6 (of 6).