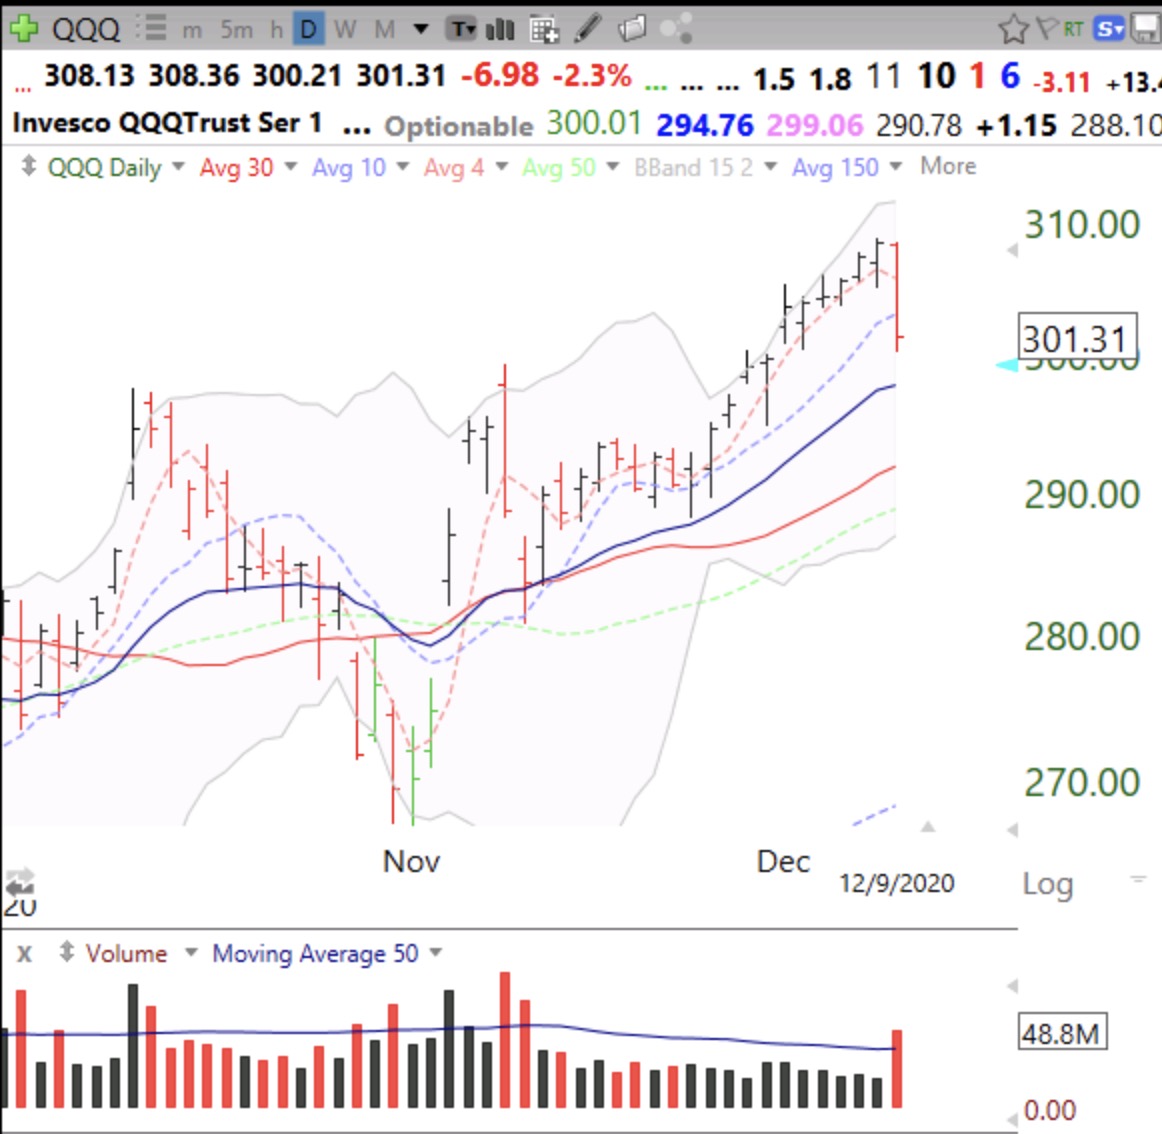
With the end of quarter coming it would not surprise me to see a huge end of year rally. Mutual funds’ quarterly reports will aim to show ownership of the best performing stocks the past few months (without telling when they purchased them) . My GMI components are all positive. Most advances begin from an oversold position, as last occurred in November. Waiting for a bounce off of a key moving average or the lower 15.2 Bollinger Band.