GMI: +1; WPM shows weakening; Folly of fighting market’s trend; On Nicolas Darvas

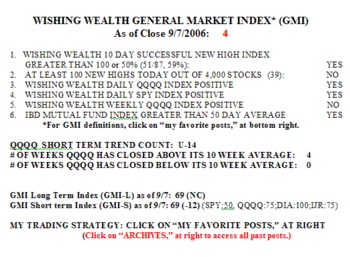
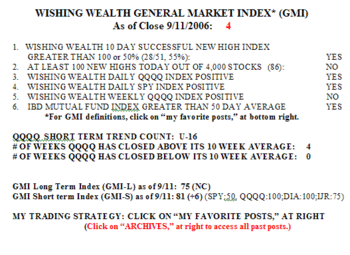
What a devastating week for the bulls.     The market internals continue to weaken, with only 24% of stocks in my universe of 4,000 in a short term up-trend.   The GMI remains at +1, with only the Weekly QQQQ Index still barely positive.   There were only 28 new highs on Friday and three times as many new lows.   On Friday, only 55% of the Nasdaq 100 stocks, 66% of the S&P 500 and 50% of the Dow 30 stocks advanced, an insignificant bounce up from the week long decline.   Friday was the third day in the QQQQ down-trend (D-3).   Since its peak on August 2, the QQQQ   (Nasdaq 100 ETF) has declined 4.3% and only 34% of its component stocks have advanced, with only 18 stocks (18%) advancing 5% or more.   Why fight these odds?

The WPM shows the extraordinary weakness in the short and long term trend measures of   five market indexes.     All five indexes are below their 30 day averages and only 20-34% of their component stocks are above their 30 day averages.   The Dow 30 stocks continue to show the greatest weakness, short and long term.   The big industrial Gmi1007companies are clearly weak.   The DIA and SPY ETF’s are both below their 30 week averages, an indication of longer term weakness in trend.   Only 30-50% of the component stocks in all five indexes closed above their 30 week averages, suggesting that all of these indexes may find themselves below this key average soon……….

It has taken me 40+ years of trading to understand the folly of fighting the overall market trend.   Whether I look at Livermore’s “line of least resistance,” or O’Neil’s “M” in CANSLIM, or Nicolas Darvas’ writings (See Boik’s books at right) I find these gurus all saying that there is a time to be out of the market when it is declining, or to be short.   This is a very difficult rule to follow because even in weak markets, I am tempted to go long when I find the “perfect” text book price pattern that brought huge profits in a prior rising market.   The critical point to remember is that the same price pattern that works so well in a rising market, is likely to fail in a declining market.  Half of the battle for Wpm1007conserving capital is to resist the temptation to buy that unusually strong stock in a bad market.   The odds of success are against me.   And yet, being in the market is so seductive.   (One way I handle such a temptation is to use a very small portion of my portfolio to buy that irresistible stock–just in case I am right.) This topic is so important, I will prepare another post this weekend that will delve into the writings of my favorite guru, Nicolas Darvas, as they apply to the importance of following the market trend.

Corrected GMI still: +1; Weakness persists

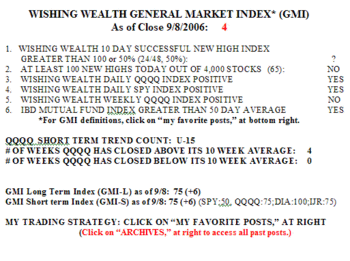
Gmi1006_1 The GMI is still +1 and the market internals deteriorated Thursday.  (I erred yesterday in saying that the QQQQ Weekly Index was negative, so yesterday’s GMI was actually +1.) There were only 22 successful 10 day new highs, the least since I started counting this statistic in May.  There were 107 successful 10 day new lows, the most I ever counted.  Clearly, buying new highs 10 days ago in the hope of making a profit has been unlikely to work out, and was far less successful than shorting new lows.  Only 26% f the 4,000 stocks in my universe are in a short term up-trend, and only 30% are above their 10 week averages.  There were 28 new highs and 152 new lows on Thursday.  Only 23% of the Nasdaq 100 stocks rose, along with 30-31% of the S&P 500 and Dow 30 stocks.  More stocks are now within 5% of hitting a new low (13%) than of hitting a new high (11%).  Thursday was the second day  (D-2) in the QQQQ down-trend……………

I am therefore mainly in cash.  I will use any bounce to unload my few holdings if they start to weaken again.  The trading gurus I admire all said to get out of the market when the trend is down–except to take the short side.  With more daily lows than highs and with more stocks near new lows, taking the long side is clearly going against the trend………..

Please send me your feedback at: silentknight@wishingwealthblog.com.

GMI: 0; Disastrous day; Hindenburg Omen; Recession? 4 year cycle

We didn’t have a lot of warning, but I did say yesterday that I should be on the sidelines, after Tuesday’s action.  Wednesday, the GMI went to zero. Gmi1005_3 There were only 54 successful 10 day new highs–stocks that hit a new high 10 days ago and closed higher Wednesday than 10 days earlier.  In other words, only 35% of the stocks that hit new highs 10 days ago closed higher Wednesday than the day they hit their new high.  Many of the gurus cited in the books to the right have observed that failed break-outs are a sign of impending market weakness.  In addition, there were more (99) "successful" 10 day new lows, suggesting that shorting stocks at new lows has been profitable.  There were only 41 new yearly highs but 148 new lows.  I mentioned last post that having a lot of new highs AND new lows suggested a troubled market.  Well, I read today that this phenomenon is known as the "Hindenburg Omen."  Only 8% of the Nasdaq 100 stocks and the S&P 500 stocks advanced on Wednesday along with 3% (1) of the Dow 30 stocks.  The last time we saw numbers like this was on August 16, a day when the averages also first closed below their 30 day averages.  Yes, the DIA, SPY and QQQQ are now all below their 30 day averages and the DIA and SPY are below their 30 week averages, suggesting longer term weakness.  Only 36% of the stocks in my universe of 4,000 are above their 10 week average, the lowest number since I began tabulating this statistic on June 17.    Note that there are almost as many stocks within 5% of their yearly lows (12%) as there are close to their yearly highs (14%).  Only 59%  (down 14%) of the strongest stocks that have doubled this year remain above their 30 day averages.  This is day one (D-1) of the new QQQQ down-trend……….

As I said yesterday, this is not the time to be a hero–I am mainly on the sideline.  The crack in the housing stocks is finally upon us and their demise may signal dire consequences for the economy.  If we get a bounce during earnings season the next few days, it might be a good time to unload losers and raise cash.  With the GMI at zero, I remain very cautious. Jim Rogers, a very successful trader with George Soros, opined this week on "Cavuto on Business," that we will be in a recession next year.  In addition, I have written before that the 4 year stock cycle of bear/weak markets 62, 66, 70, 74, 78, 82, 87 (late one year and crashed) 90, 94, 98, 02…..  also suggests that we are due for a bad market in 06.  Is the Fed destined to over-tighten and bring on a recession……..

Please send me your feedback at: silentknight@wishingwealthblog.com.