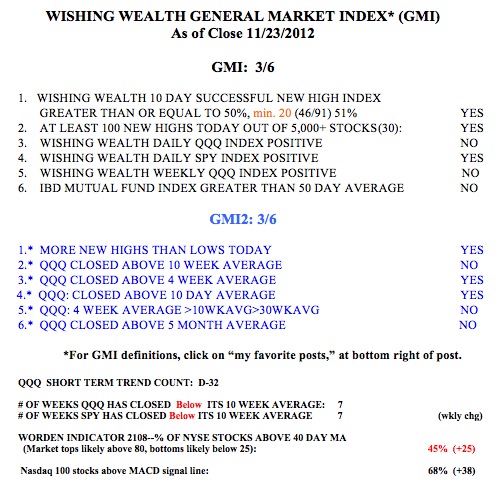
One more strong day for the QQQ will begin a new short term up-trend. However, the GMI is back to 2 and it will take a few more strong days for that indicator to signal a buy. Even so, I nibbled a little at TQQQ on Monday and will add more on Tuesday if a new short term up-trend should begin. I am never confident of a short term trend change until it reaches day 5.
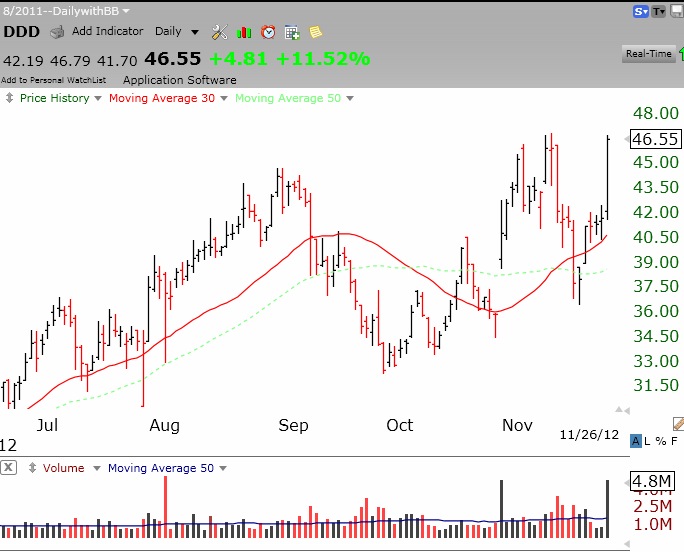
Last May 24, I wrote that my “concept” stock buddy, Judy, liked the 3D printing business and the company, DDD. DDD closed then around $30. Well, look at the day DDD had on Monday, up 11.5%! 3D printing is an entirely new field of technology. If you think that it is related to those movies we saw as kids with those special red and green glasses, you better research this new concept! Below is a daily chart of DDD. Note its two recent advances on huge trading volume–funds are buying. (Click on chart to enlarge.) Is this a promising cup and handle pattern? Given the stock’s recent relative strength, I would not be surprised to see DDD as a leader in the next market advance. Also check out SSYS, another 3D company.