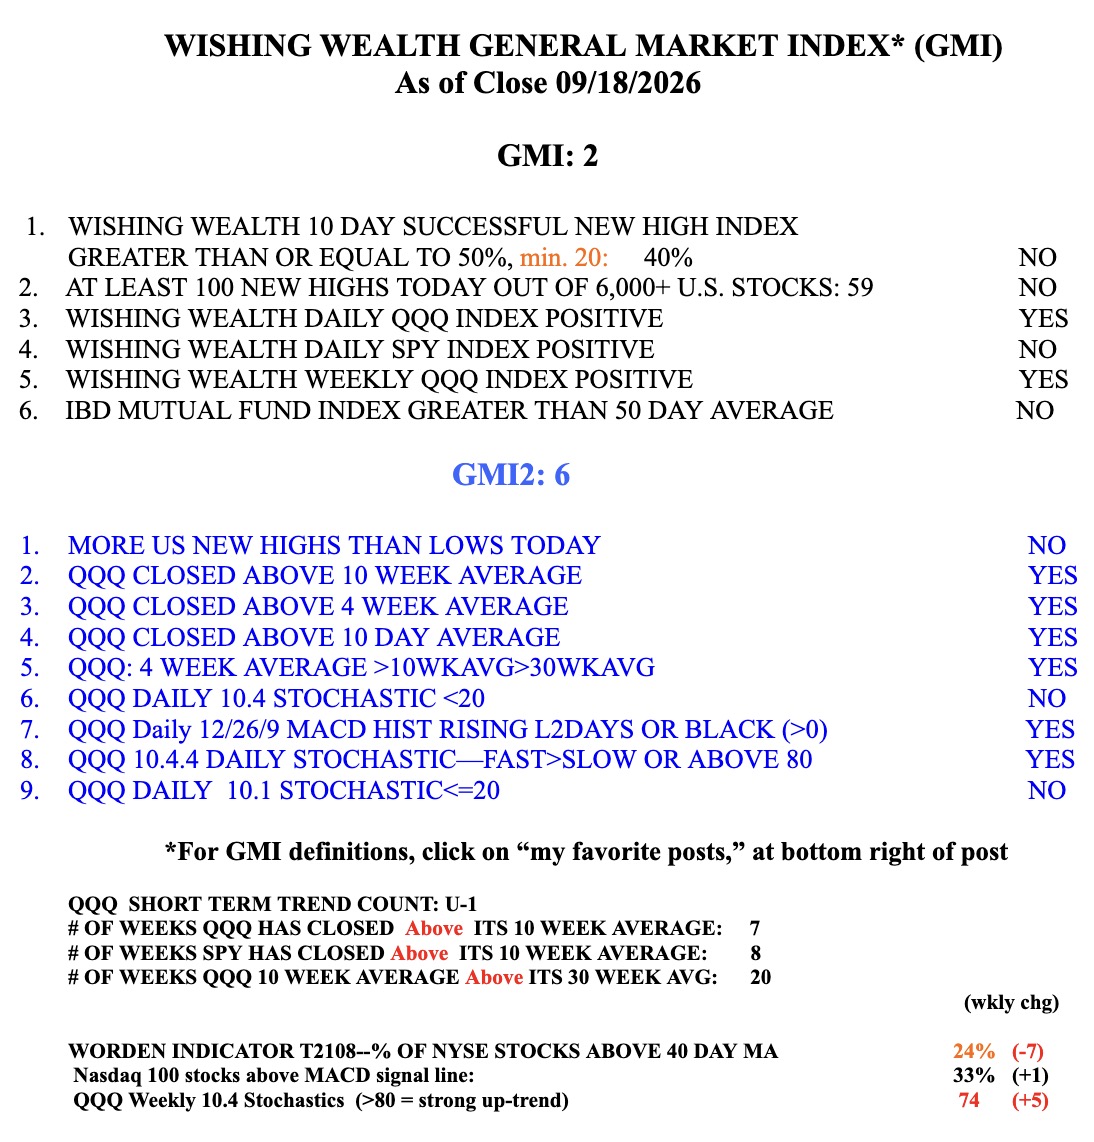
I have never seen anything like this situation. T2108 shows that only 24% of NYSE stocks closed Friday, above their 40 day averages of price, a level last reached in the large market decline last April.
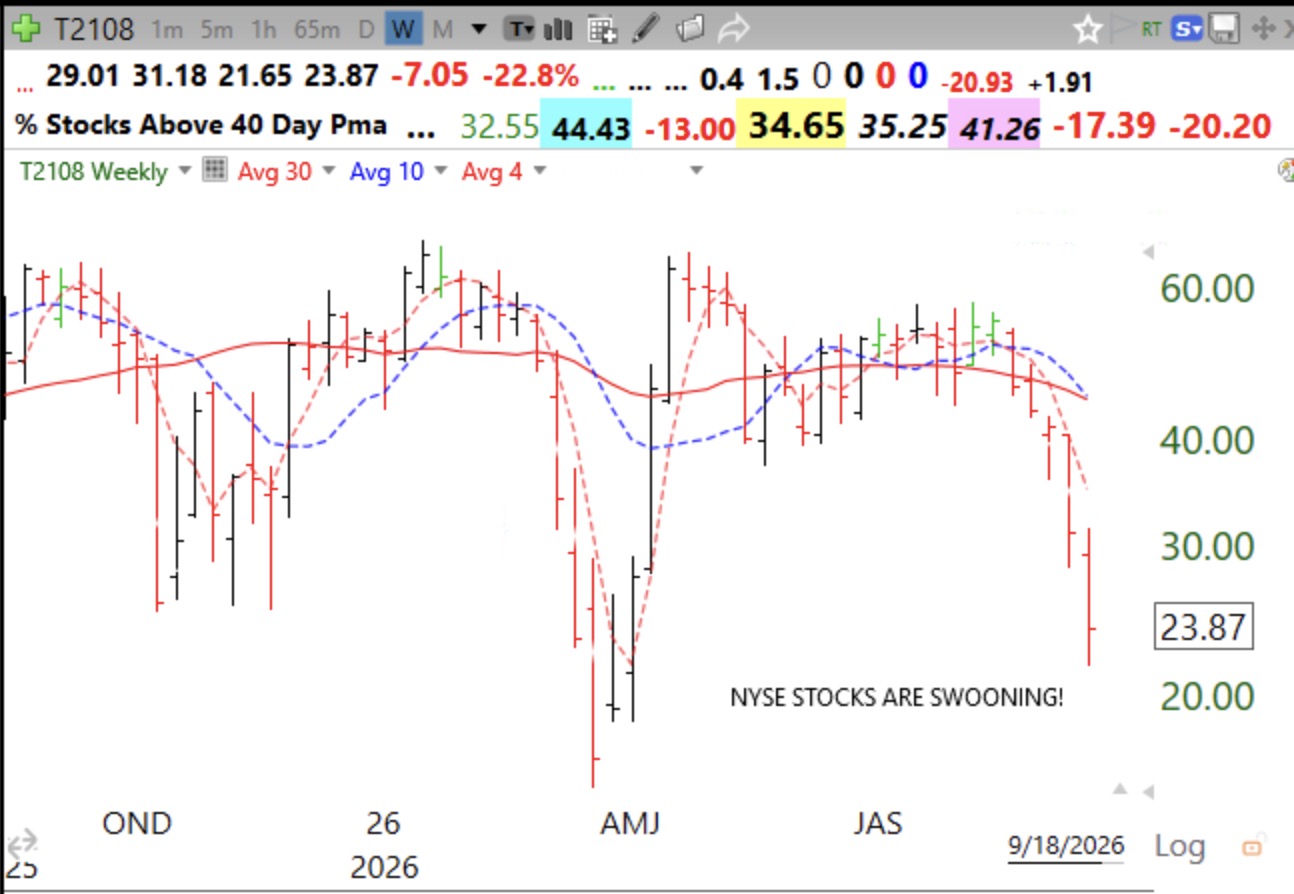
And the equal weighted S&P500 stocks ETF is also weak.
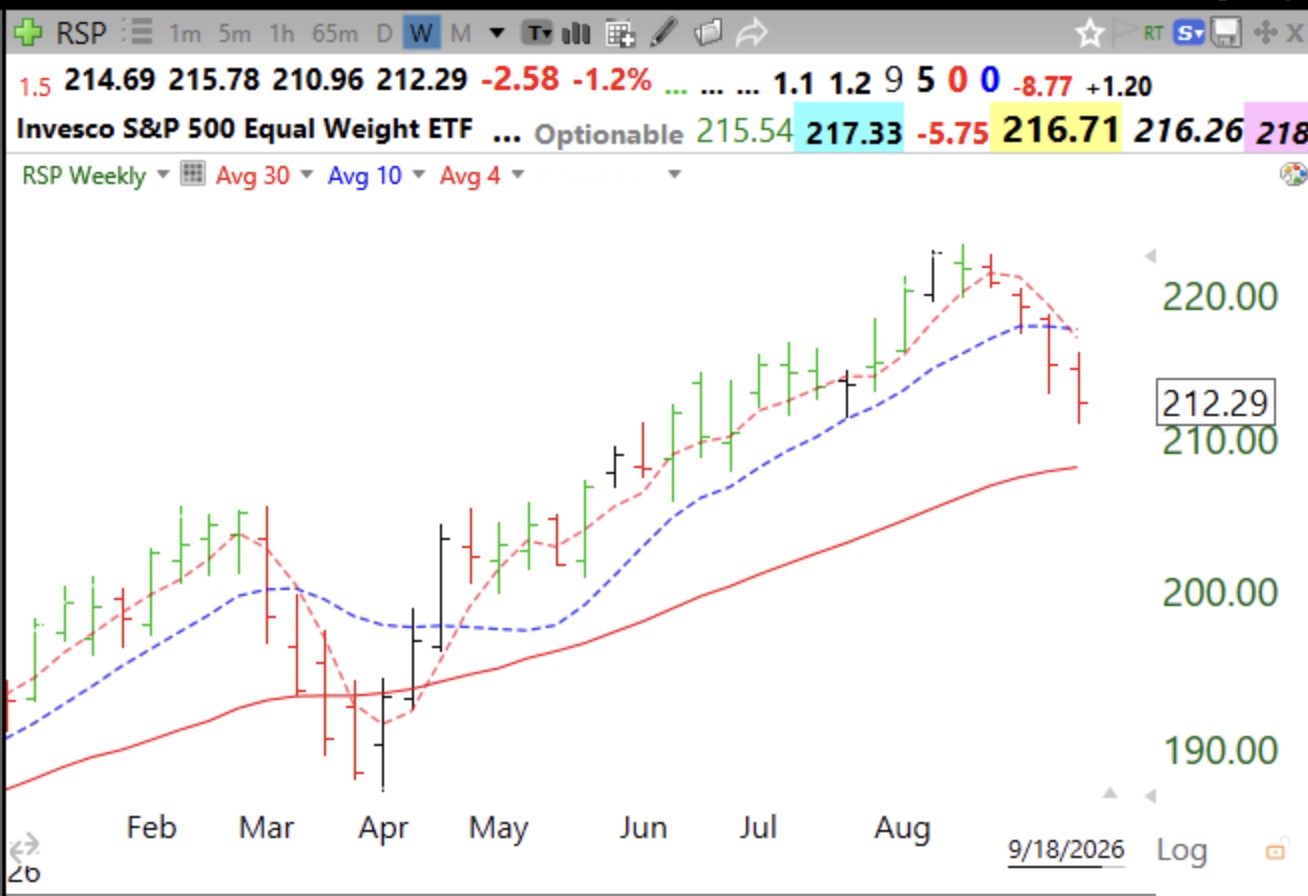
But the capitalization weighted SPY ETF looks stronger.
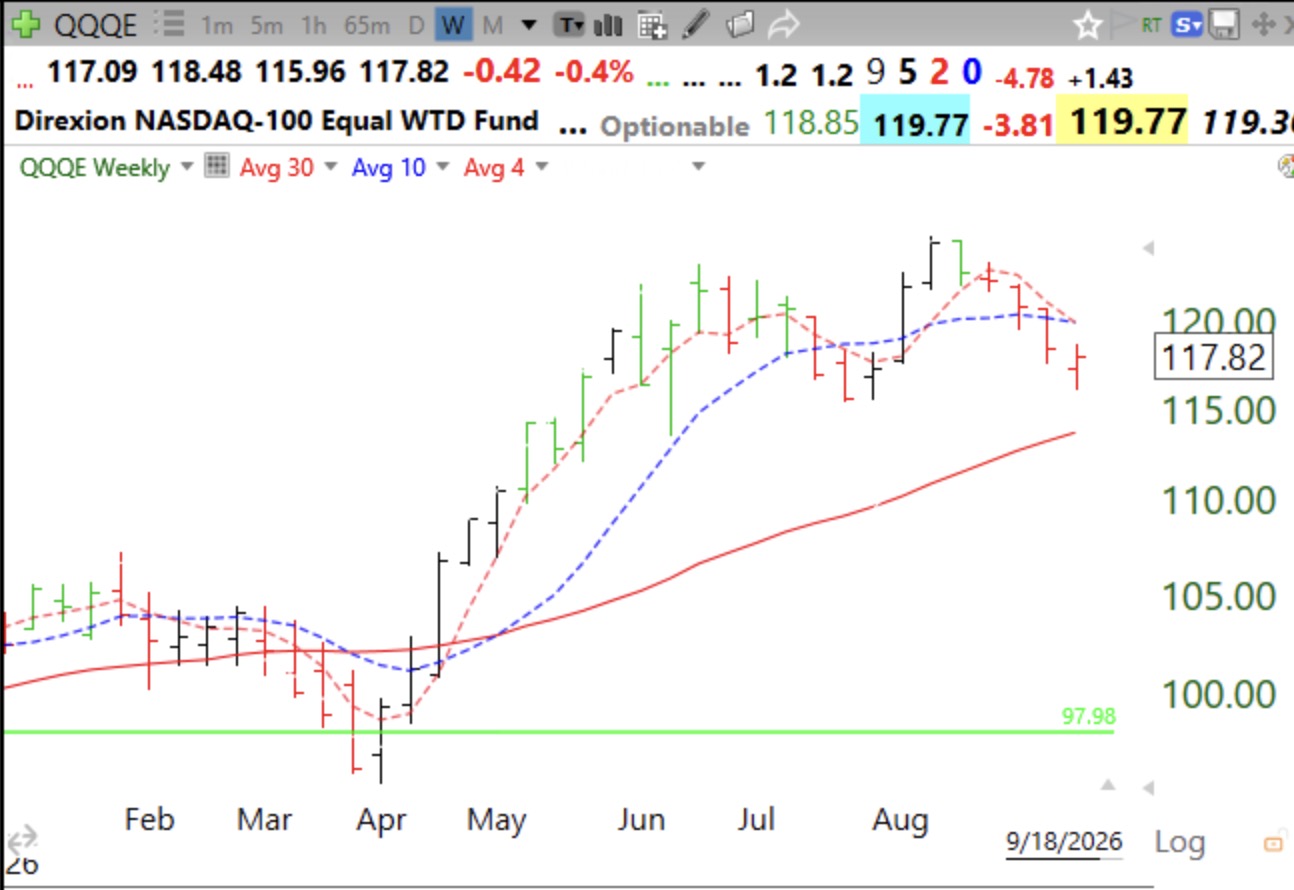
QQQE, the equal weighted QQQ, declined last week:
While the cap wtd QQQ rose!
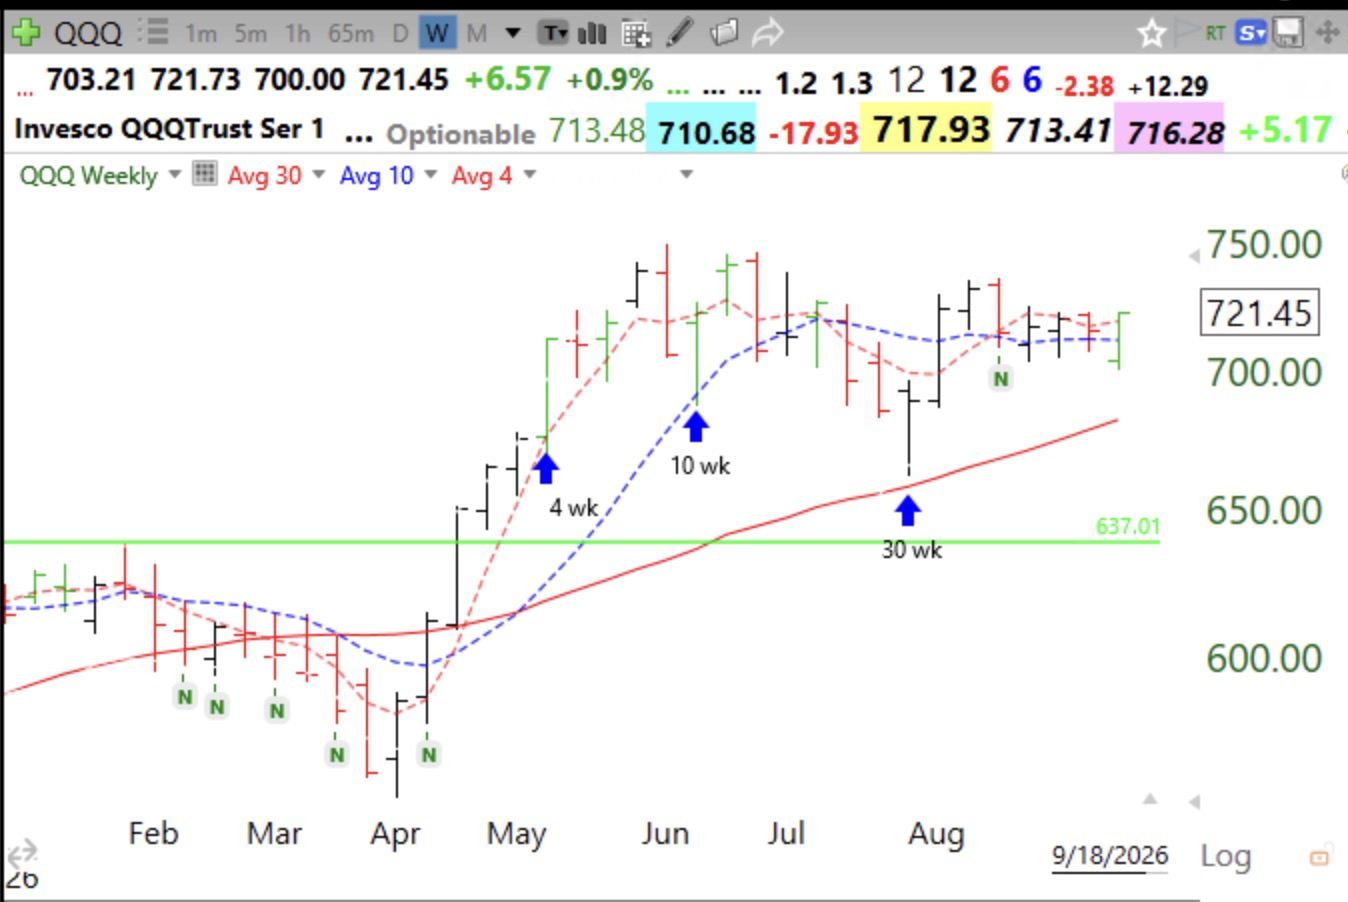
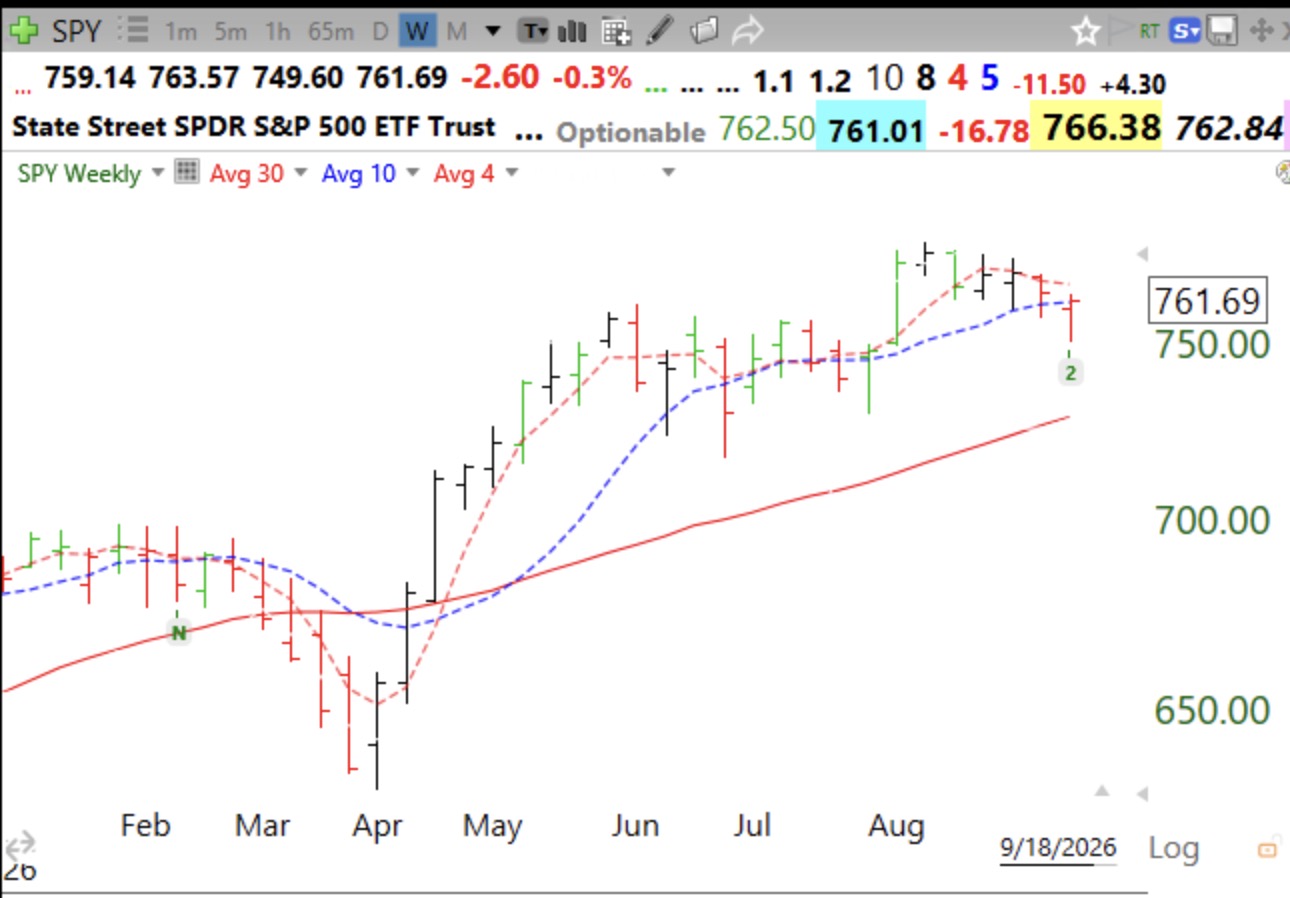
What does all this mean? It means that the cap weighted indexes whose averages are driven largely by the popular big tech stocks, are masking the decline occurring in most stocks! On Friday, more US stocks hit yearly lows than highs (119/59) and only 15 of 6500+ stocks reached an ATH! This is not the time for me to be buying stocks trading at ATHs. The odds are against me. Only 34% of the NASDAQ 100 stocks closed Friday above their 50 day averages! But my GMI table below shows that on Friday, QQQ actually began Day 1 of a new short term up-trend! My GMI and GMI2 stats are based almost totally on the cap weighted index, QQQ. To rely on the cap-weighted stock indexes is now misleading until the equal weighted indexes should again correlate better with them. Either the large cap stocks will lead the other stocks up or they will follow the smaller cap stocks down. Stay tuned!