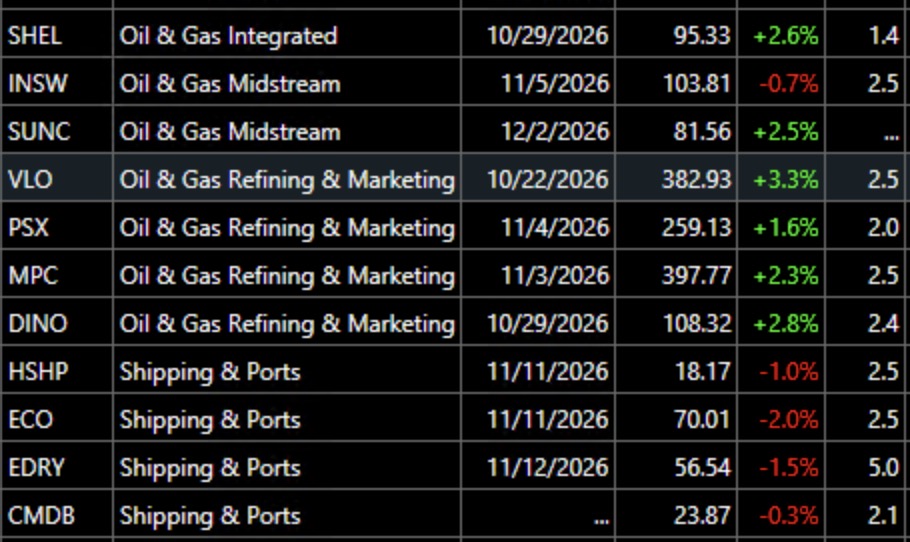
The last column shows current price divided by their prices 250 days ago. EDRY is 5x its price a year ago. Note the estimated earnings release date is in the third column. I focus on stocks reaching an ATH. In April and May it was semiconductors.
Stock Market Technical Indicators & Analysis
The last column shows current price divided by their prices 250 days ago. EDRY is 5x its price a year ago. Note the estimated earnings release date is in the third column. I focus on stocks reaching an ATH. In April and May it was semiconductors.