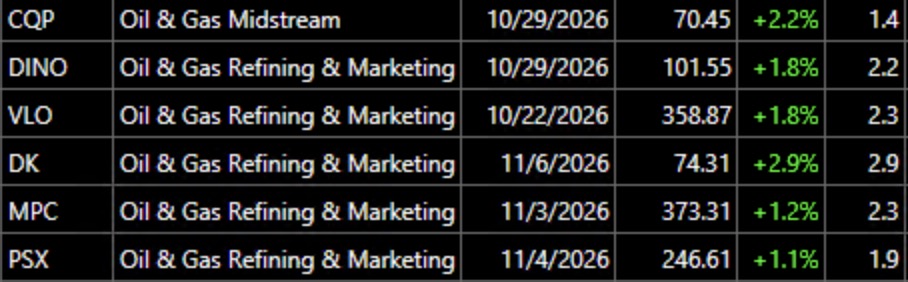
Here are the six stocks that traded at an ATH (all-time high) on Monday. All of them, but CQP, closed 1.9X or more above their price a year ago, shown in last column.
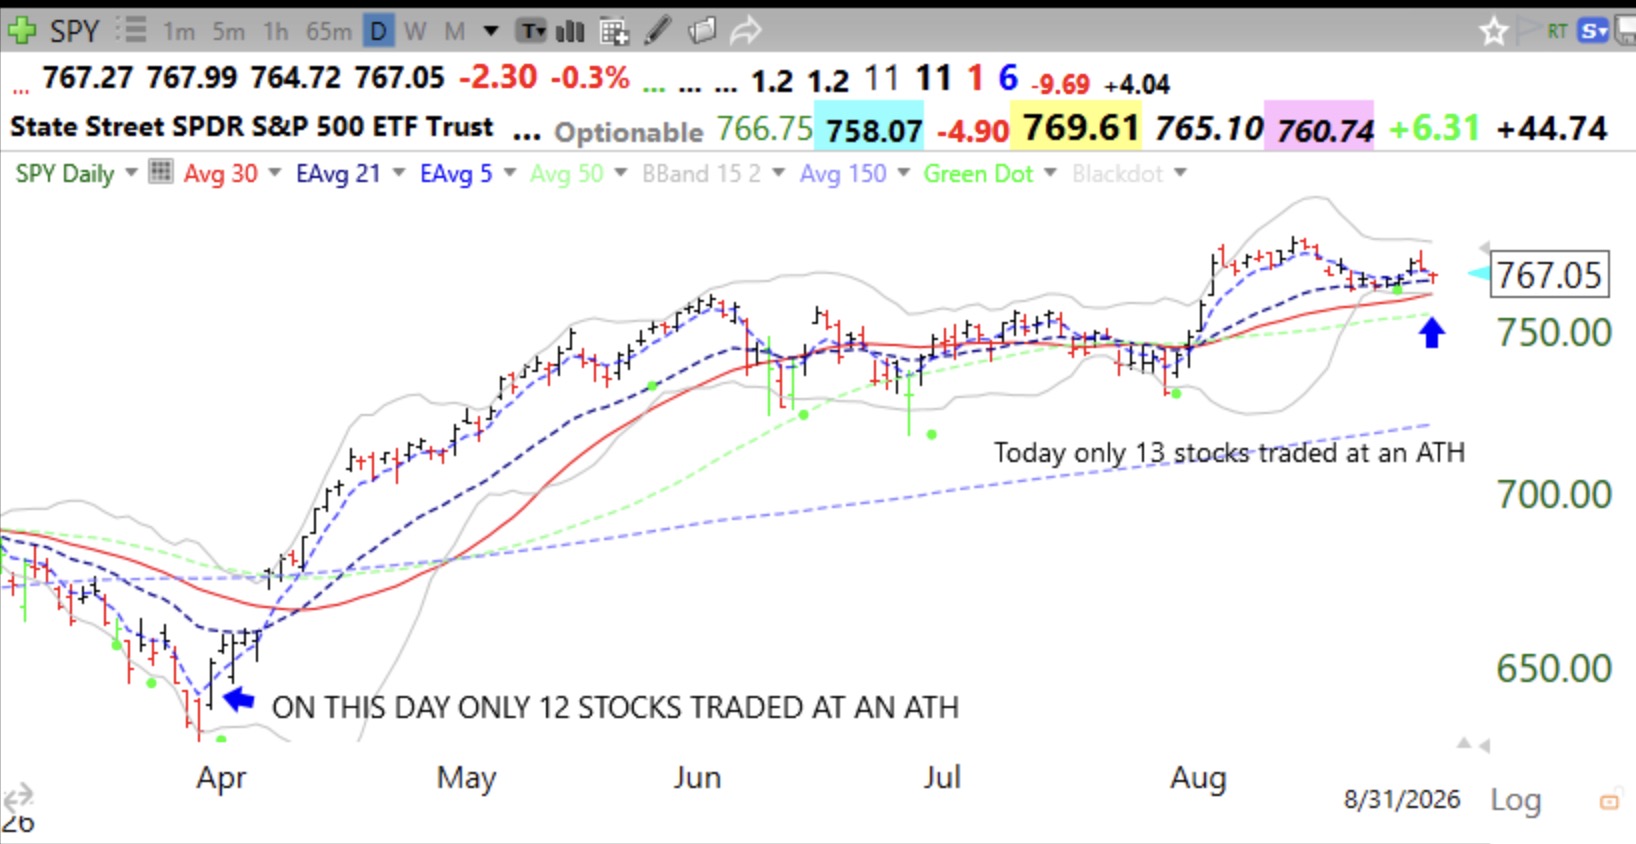
As you know, I focus on buying stocks at or near their ATH. Usually there are only a small number each day that do so. For example, last week, Monday through Friday, the totals were: 43,41, 28, 28, 20. Thus, each day <1% of the 6,500+ US stocks in TC200’s database traded at an ATH. I like to buy stocks trading at an ATH because they are exhibiting incredible relative strength, beating 99% of all other stocks. The last time that there were so few ATHs and there were more stocks reaching a 52 week low than high occurred late last March just before the markets bottomed and took off on a nice sustained tradable rise. But back then my moving averages had declined to multi-week lows. That is not the situation now. So, I am not ready to say that this low number of ATHs indicates a bottom but something else may be happening. This daily chart of SPY shows no decline currently like we experienced in late March. So what does this all mean? I suggest that market makers and other traders can no longer push many stocks to ATHs. Maybe these statistics are saying the market is really overbought and near a major top? I remain mainly in TBIL in my trading account and have a few very small positions of individual stocks. As a recent retiree, I am a chicken and have one foot out the door….
Thank you Dr. Wish. I’ve been tracking the number of ‘A’ stocks listed on IBD. Monday was the lowest (my count 664) in a long time. I don’t think I’ll be buying anything until it’s above ~ 950. Curious if you’ve ever heard of this?
Hi. I also wanted to say ‘Thank you’ for all of your work here. I somehow found this site years ago, maybe 2021(?) maybe before. I check in usually weekly to see what is going on from your perspective. Your calculations and analysis are very informative and usually helps me in my decision making. Enjoy your retirement! I hope that you keep this site going for a few more years at least~