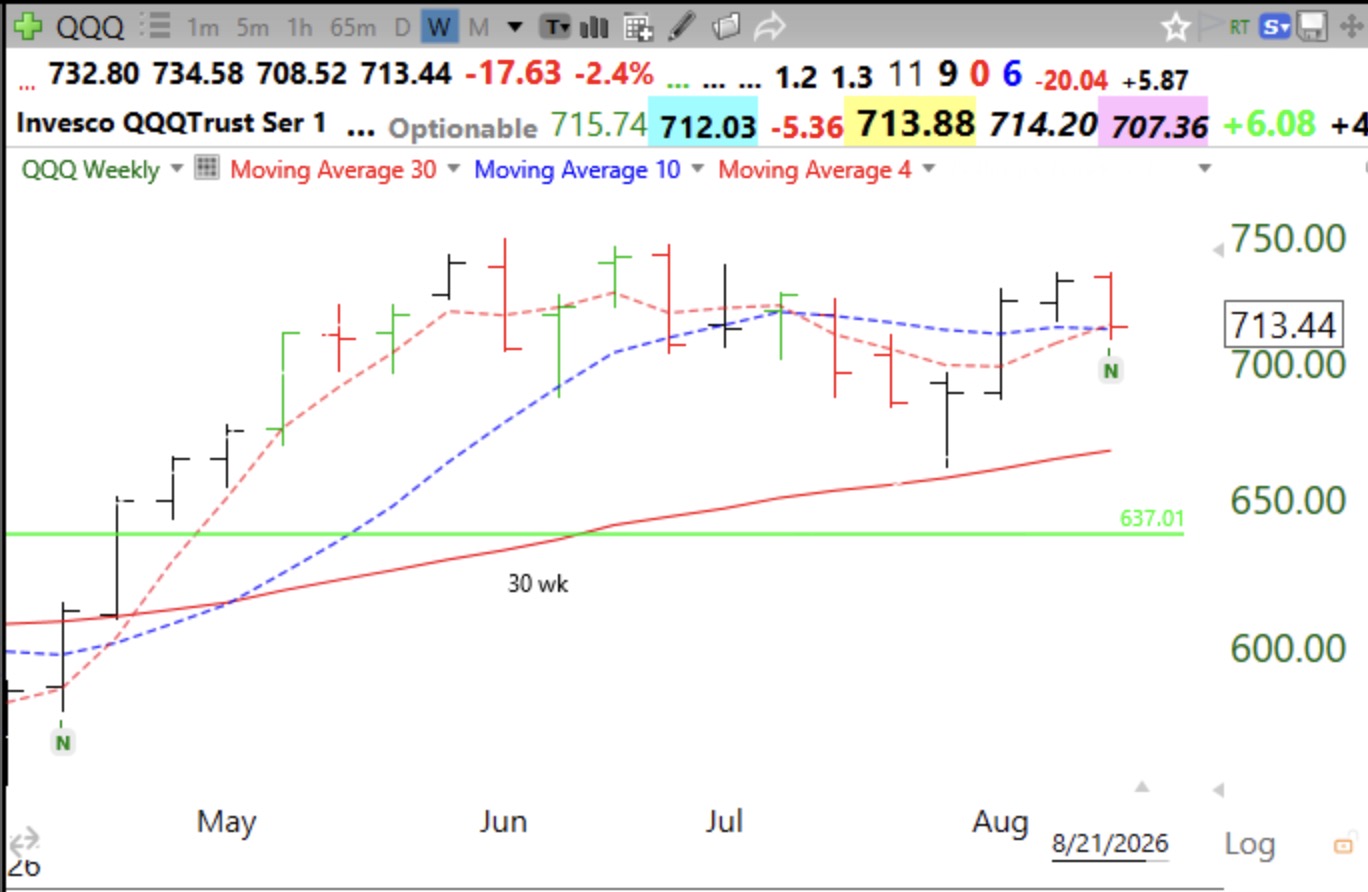
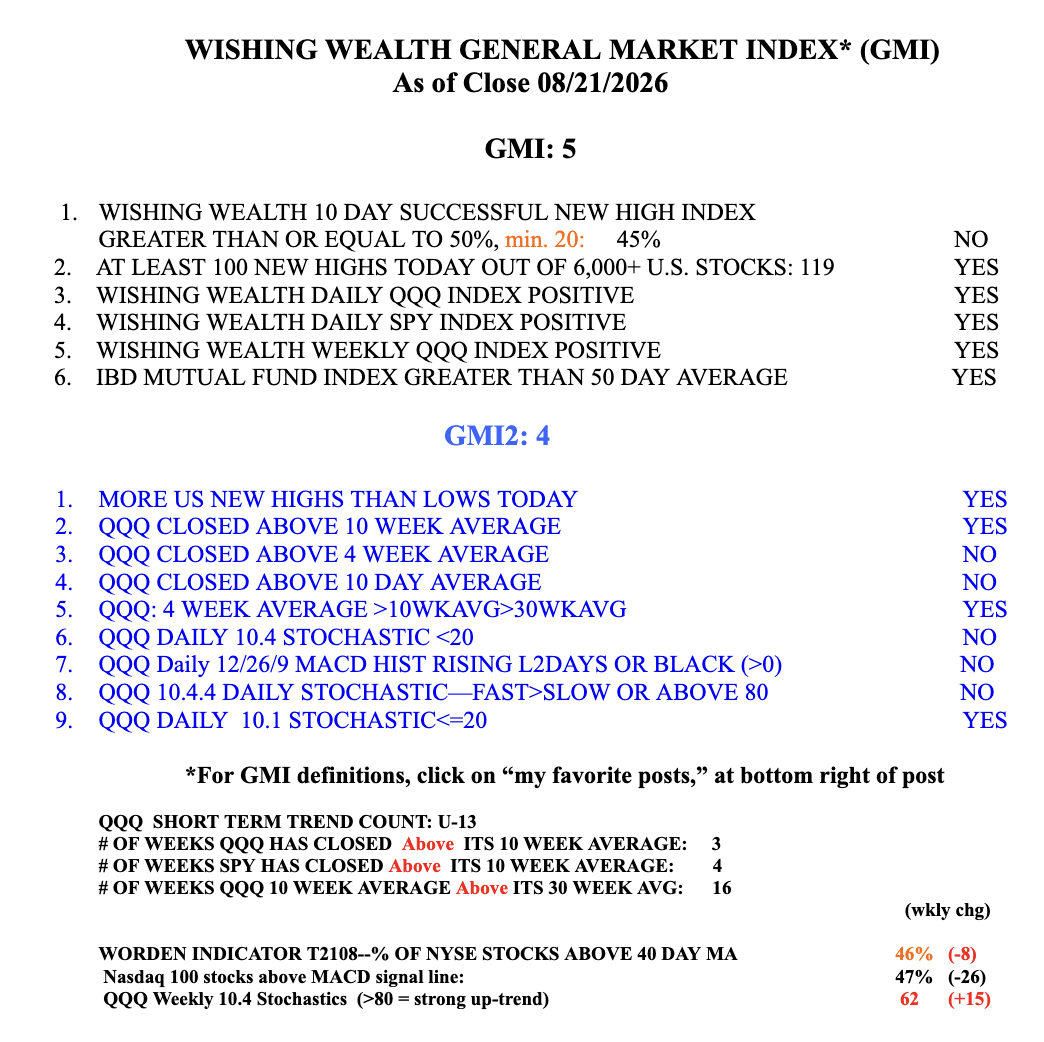
Day 13 of $QQQ short term up-trend; Weekly chart shows QQQ to be right on its 4wk and 10wk averages. This critical week should tell us whether QQQ will hold up of fall below these averages. The GMI is still Green, see table.
1 thought on “Day 13 of $QQQ short term up-trend; Weekly chart shows QQQ to be right on its 4wk and 10wk averages. This critical week should tell us whether QQQ will hold up of fall below these averages. The GMI is still Green, see table.”
Thanks for taking your time and showing us how you reason out things at critical points. You don’t know if something will kick into an uptrend or a downtrend… you just watch the indicators. Calm and patient as your just an observer for a point (association) of action. It’s nice to see how you think and what you find important on each day.
Thanks for taking your time and showing us how you reason out things at critical points. You don’t know if something will kick into an uptrend or a downtrend… you just watch the indicators. Calm and patient as your just an observer for a point (association) of action. It’s nice to see how you think and what you find important on each day.