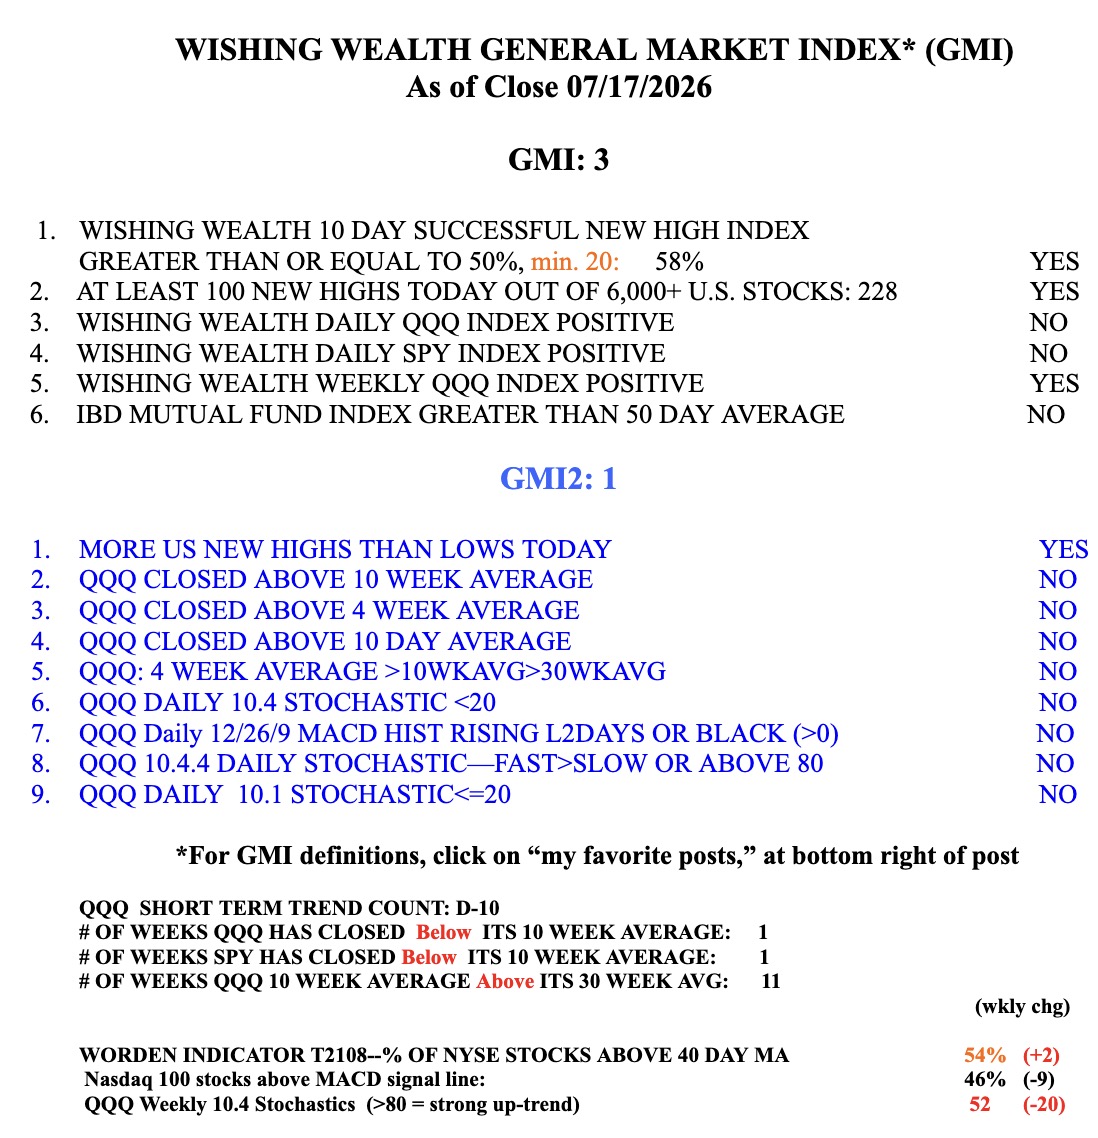
QQQ might bounce this week but still looks technically weak. Last Friday it did have a blue dot signifying an oversold bounce. Note the 30 day average, solid red line, is curving down, a major sign of weakness.
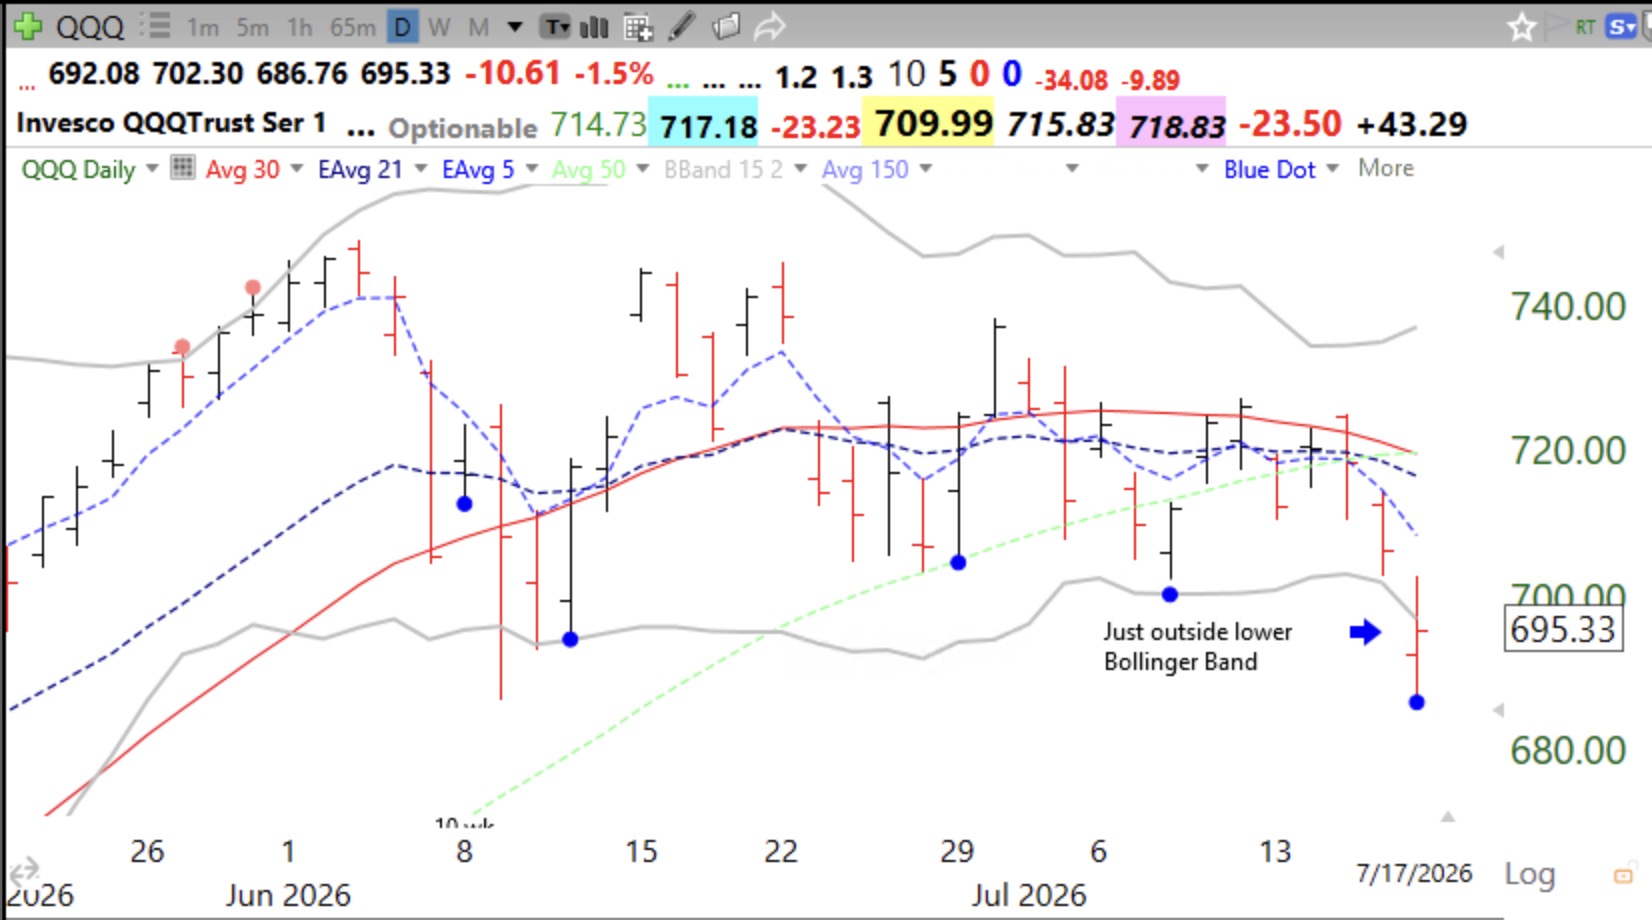
NFLX has been in a daily BWR decline since May. Always monitor the daily modified Guppy chart.There are 12 exponential averages and one average=1 to show daily closes as a dotted line. The dots show daily low prices.
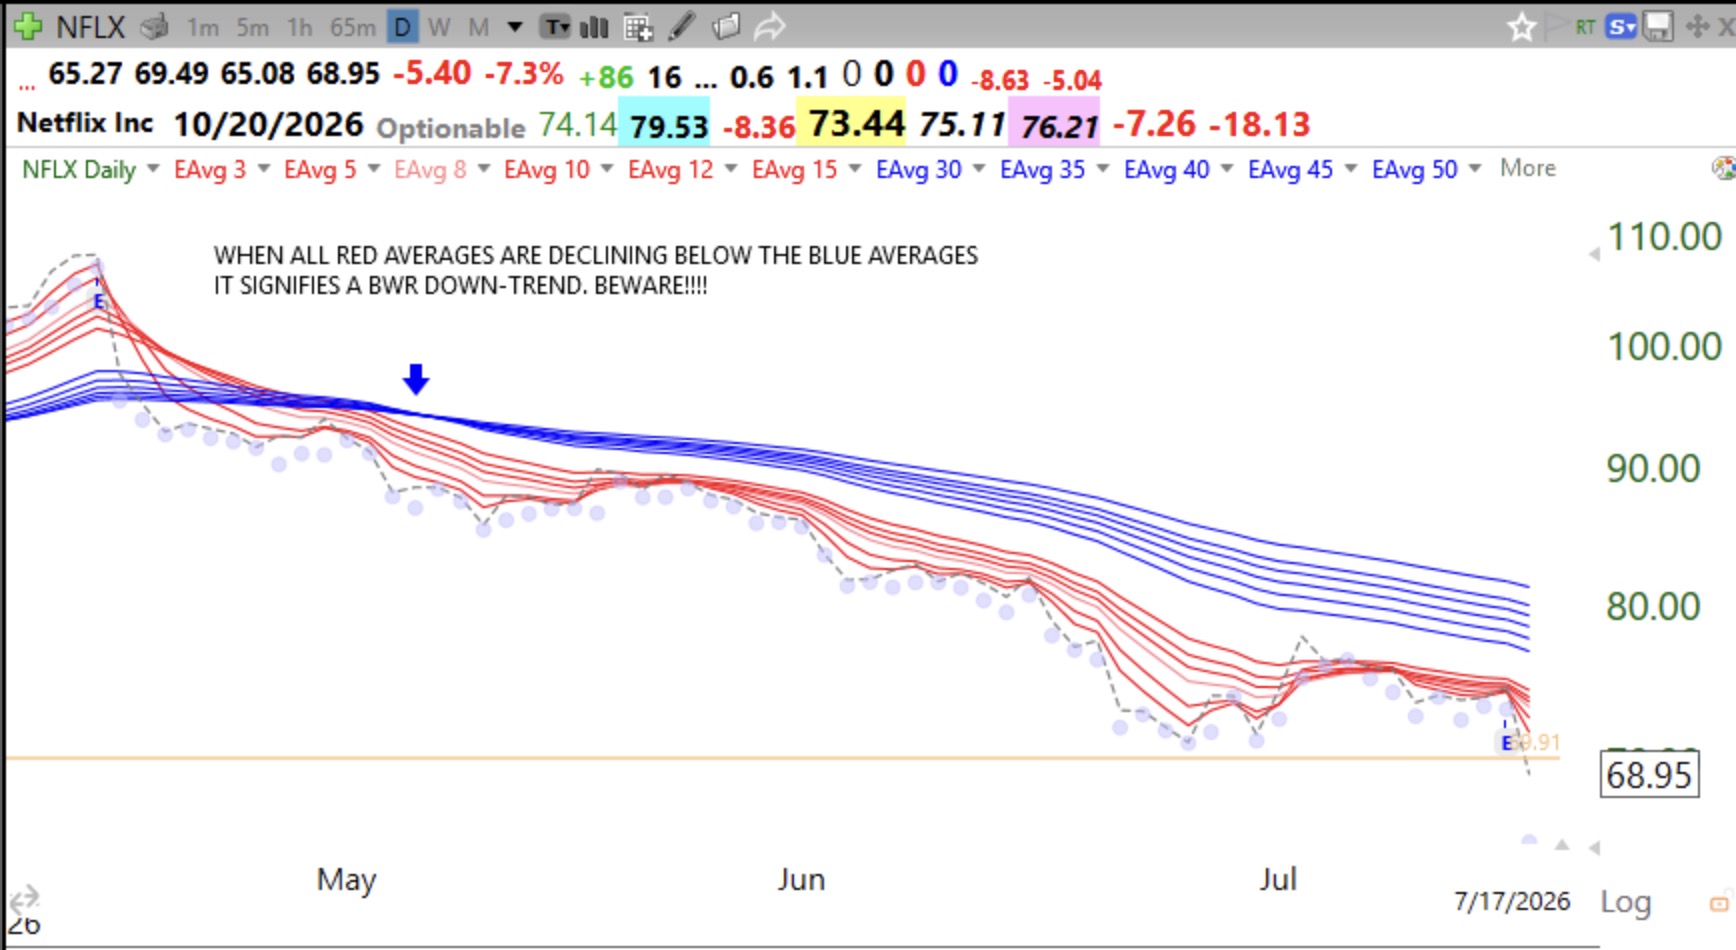
The GMI = 3 and the GMI2=1