Blog Post: Day 27 of $QQQ short term down-trend; GMI =0 and RED; More new US 52 week lows than highs; This weekly chart shows possible beginning of an ominous Weinstein Stage 4 down-trend; I remain safely in cash and watching the Worden T2108 indicator. But oversold bounce possible.

GMI0/6
GMI-21/9
T210823%

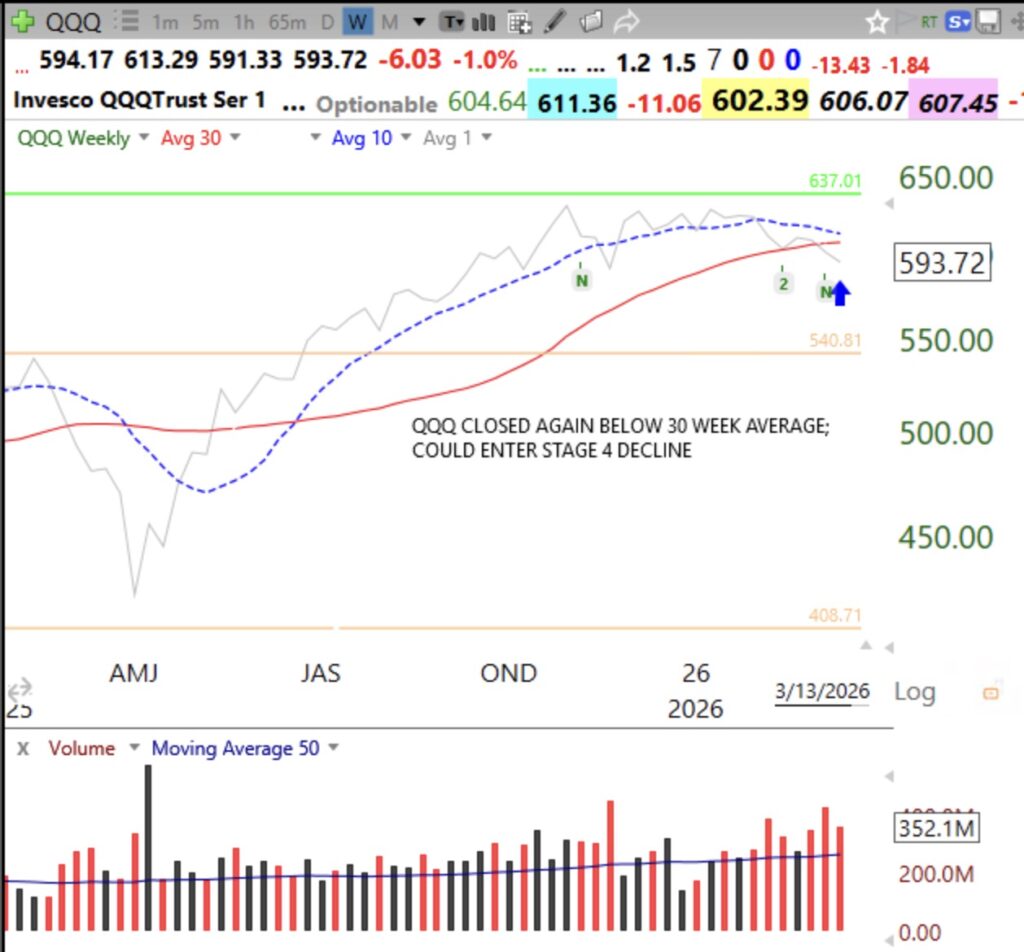
If the 30 week average curves down, it could signal the BEGINNING of a major down-trend. That signal got me out of all large declines since 2000. I refuse to put my $$$ at risk. I do not mind buying back higher if/when the trend turns up. I cannot tolerate a major drawdown in my retirement accounts. Younger people can hold on with the belief that the market always comes back. After the 1929 top, the Dow took 25 years to come back. I can’t wait a long time for my account to recover.  The market is severely oversold now, however, so we may see a quick short term bounce. Note the above average trading volume on the recent weekly declines.

I can make $$$ trading long  when the GMI is Green and above 3. QQQ has had its 10 week average rising above its 30 week average for 38 straight weeks. The 10 week average is now declining.  If it should decline to below the 30 week average, it would be quite ominous for the bulls. Watch T2108, now at 23%. If/when it declines to below 10%, I often told my students to buy a little SPY, not individual stocks,  and only to buy more very  slowly with each purchase at higher prices. I react to the market’s actions, not the news or opinions.
Screenshot


Leave a Reply

This site uses Akismet to reduce spam. Learn how your comment data is processed.