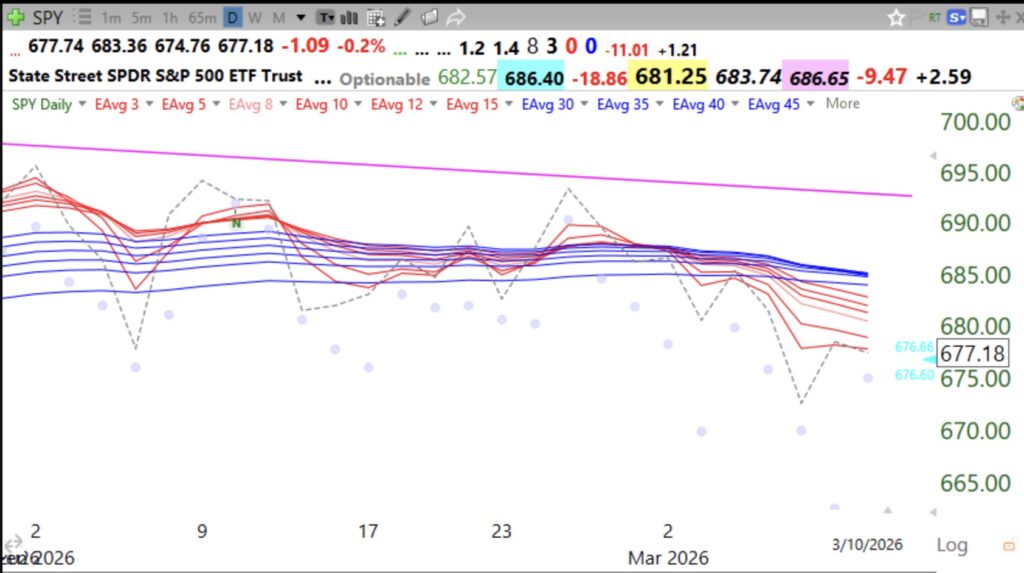
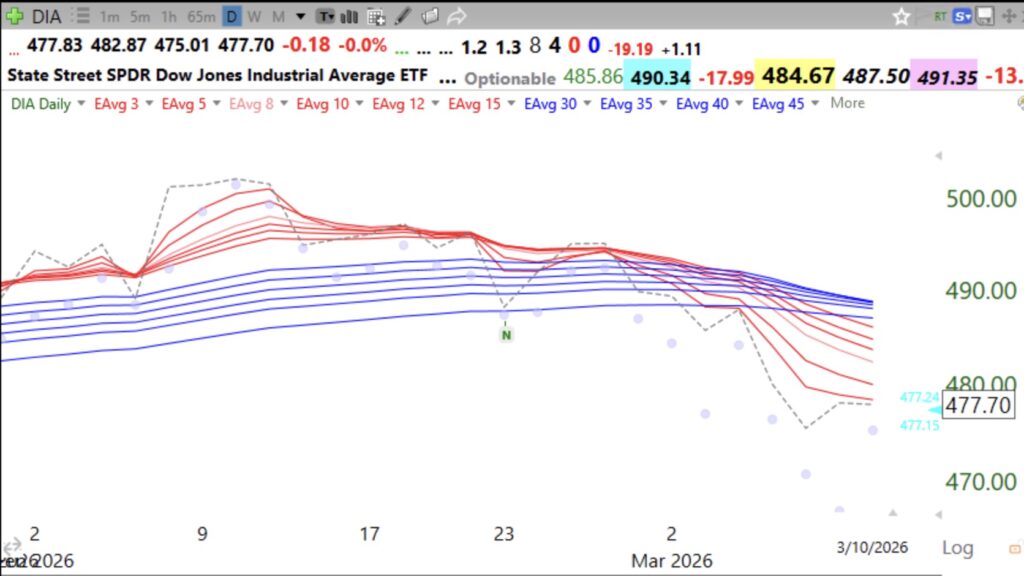
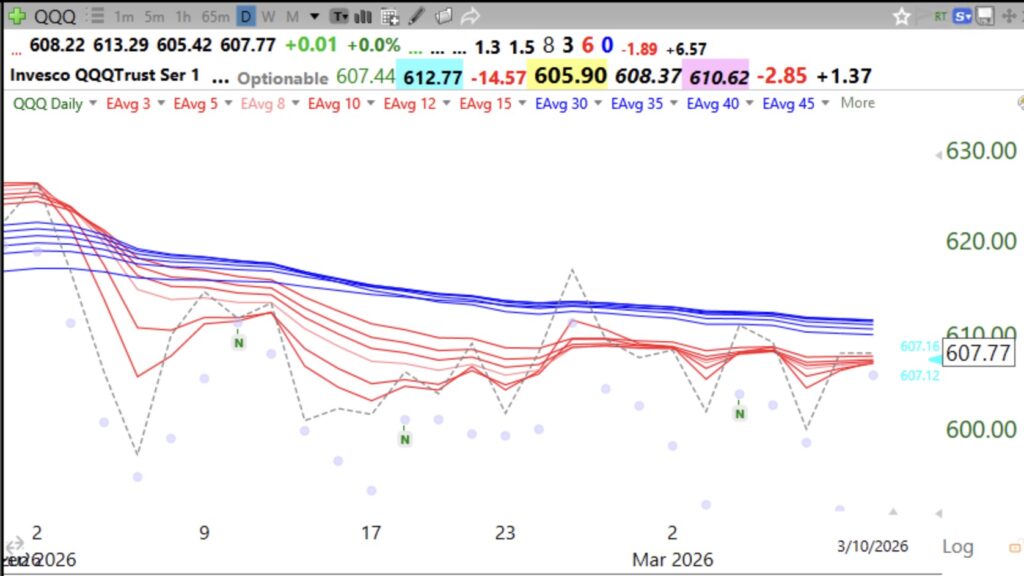
When the shorter averages (red) decline below the longer term averages (blue) leaving a white space between them, it is a daily BWR down-trend. I will not hold long positions except money market funds or treasury ETFs (TBIL). Dotted line shows daily closes. This is my modified Guppy chart based on Daryl Guppy’s GMMA indicator. Guppy’s book is listed on this blog.
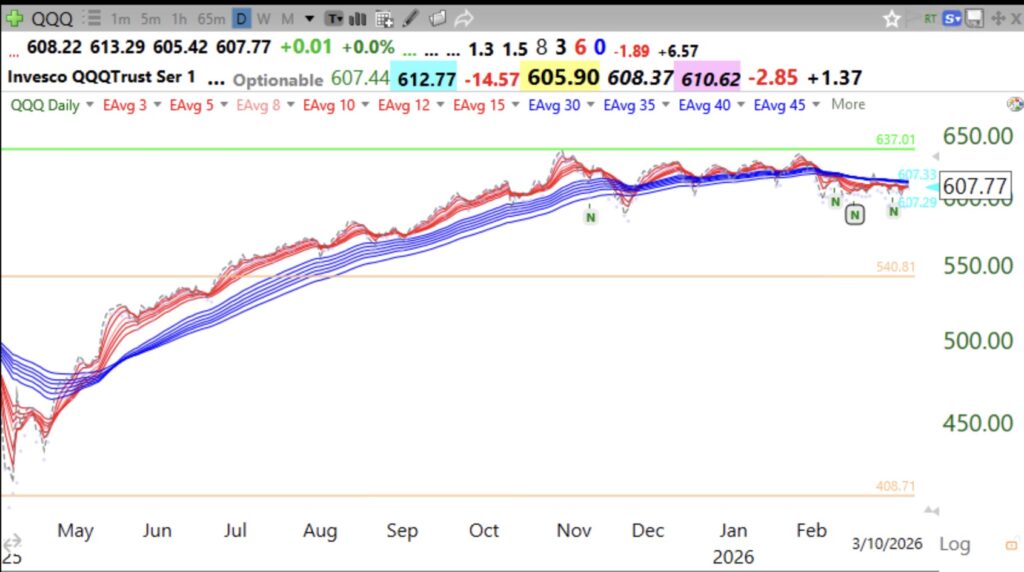
Note what a daily RWB up-trend looked like beginning last May. Ignore the news and opinions and let the market guide our trading.
Using guppy chart alone, is your signal to get in or out based on complete RWB/BWR pattern or is it when white space is gone? In other words, the red and blue moving averages start to intertwine? Will you buy some SPY if T2108 goes to 10? Thanks for all you do.
What do you think about the Put /Call ratio right now?