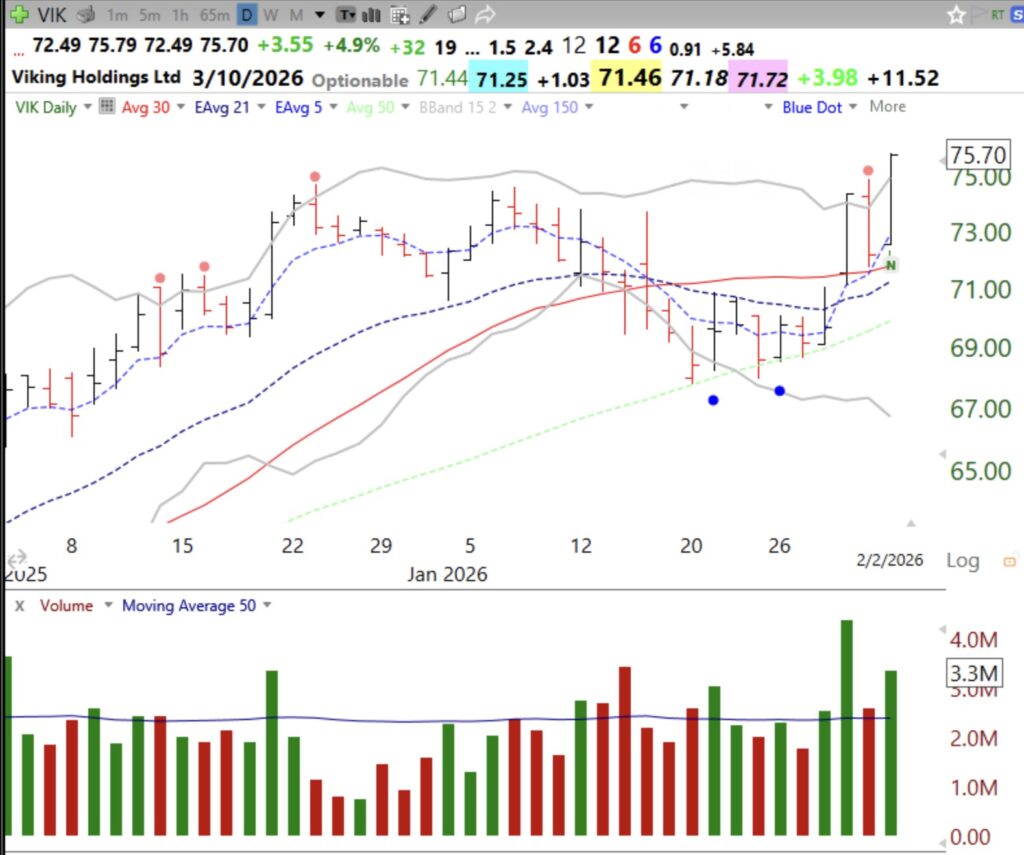
After becoming oversold and bouncing, VIK reached an ATH on Monday. Many of my Boomer friends are planning cruises and Viking is often talked about. Note this daily chart showing two oversold bounces designated by blue dots. Note the heavy volume on recent advances. The support also occurred near the 50 day average, shown by the green dotted line. VIK is now outside of its upper 15.2 daily Bollinger Band and may rest here. I would not want to see it close back below Monday’s low of 72.49.
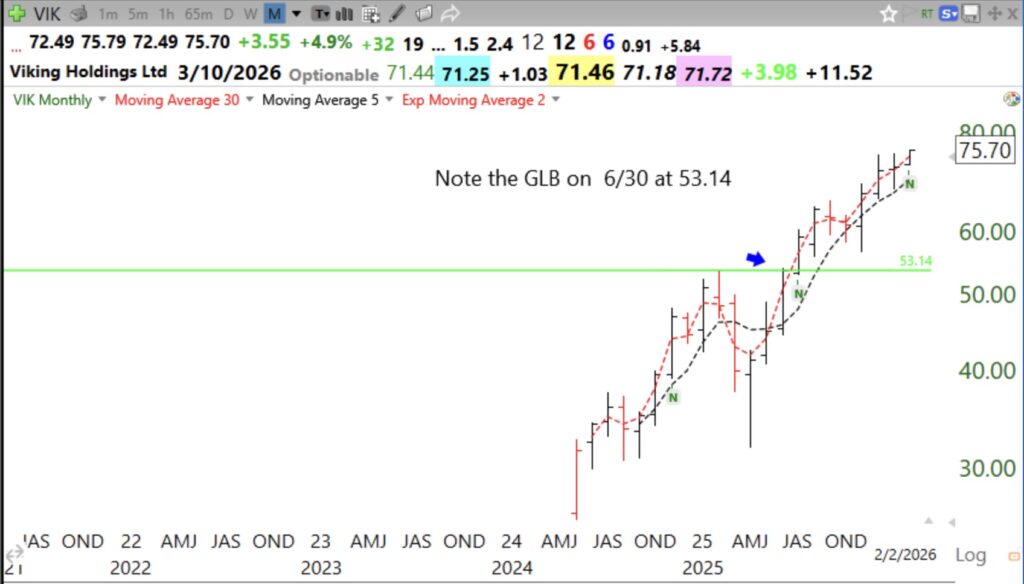
The monthly chart shows the GLB in June, 2025, and that VIK came public in May, 2024.