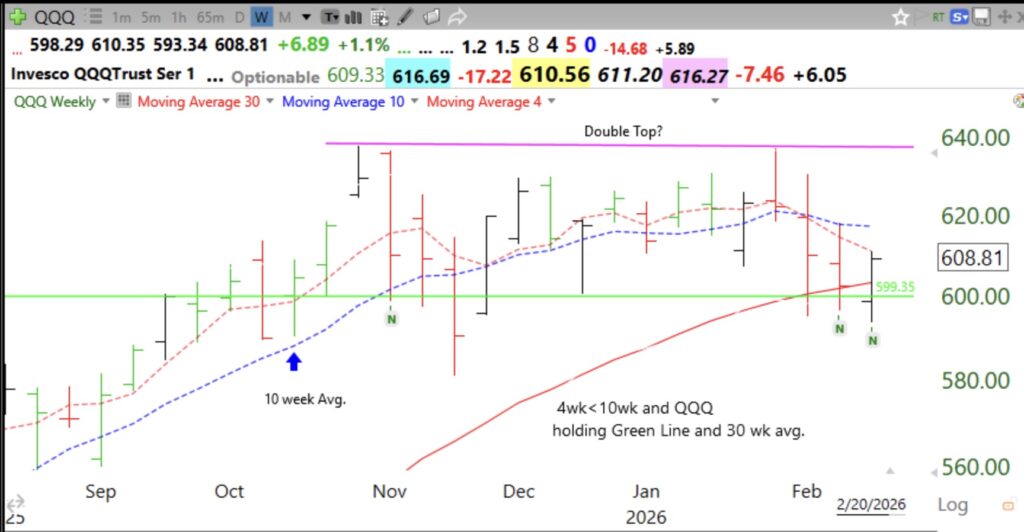
$QQQ last week held the 30 week average and the Green Line. It bounced up against its 4 week average. I expect resistance at the 4 wk and/or 10 wk averages. Let’s see if it can close back above the 4 wk average this week. If it fails to hold above the recent Green Line top, it will signify a GLB (Green Line Break-out) failure. It is also concerning that the 4 wk and 10 wk averages are declining. A close below the 30 week average (solid red line) would signal a possible Stage 3 top. A declining 30 wk average will signify an ominous Stage 4 down-trend. Note the possible double top.
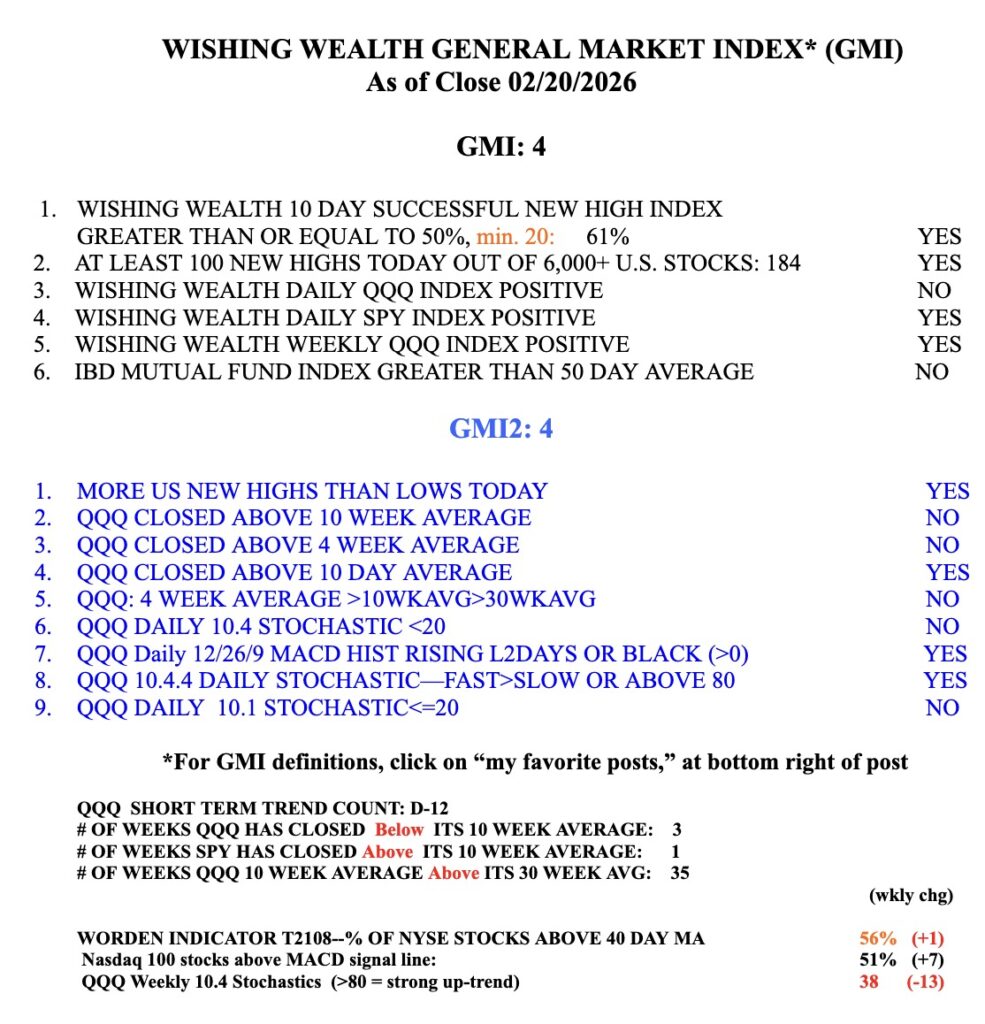
The GMI is still Green.