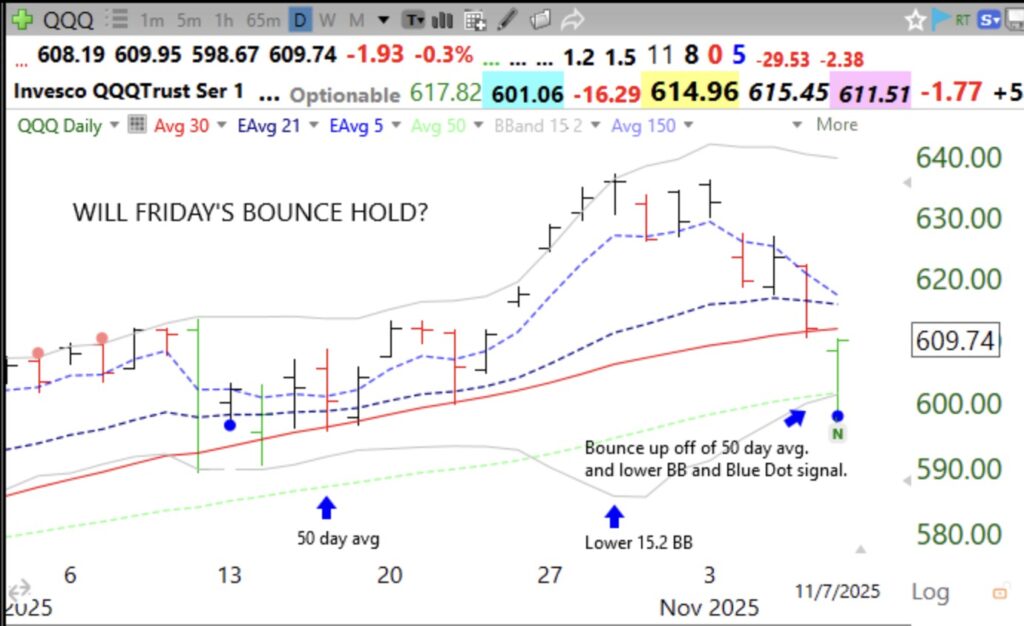
Either Friday’s bounce will hold or it won’t or it will fake us all out. The fact that QQQ (and DIA and SPY) all bounced their 50 day averages, their lower Bollinger Bands and had Blue dot signals suggests the bounce may hold. At least technical analysts will think so. But I must react, rather than predict or anticipate. If QQQ holds, I may buy some TQQQ. If it fails, I may buy some SQQQ. Or I may sit safely on the sidelines. The Blue Dot of Happiness oversold indicator is explained in my recent TraderLion Conference presentation on Day 6. These days I find it better to hold off pulling the trigger until late in the day when I know where an equity is likely to close. Otherwise I get whipsawed by the moves early in the day.
The GMI= 3 and the more sensitive GMI2=2. Another weak day for QQQ will end the $QQQ short term up-trend at day 54 and reduce the GMI to 2.
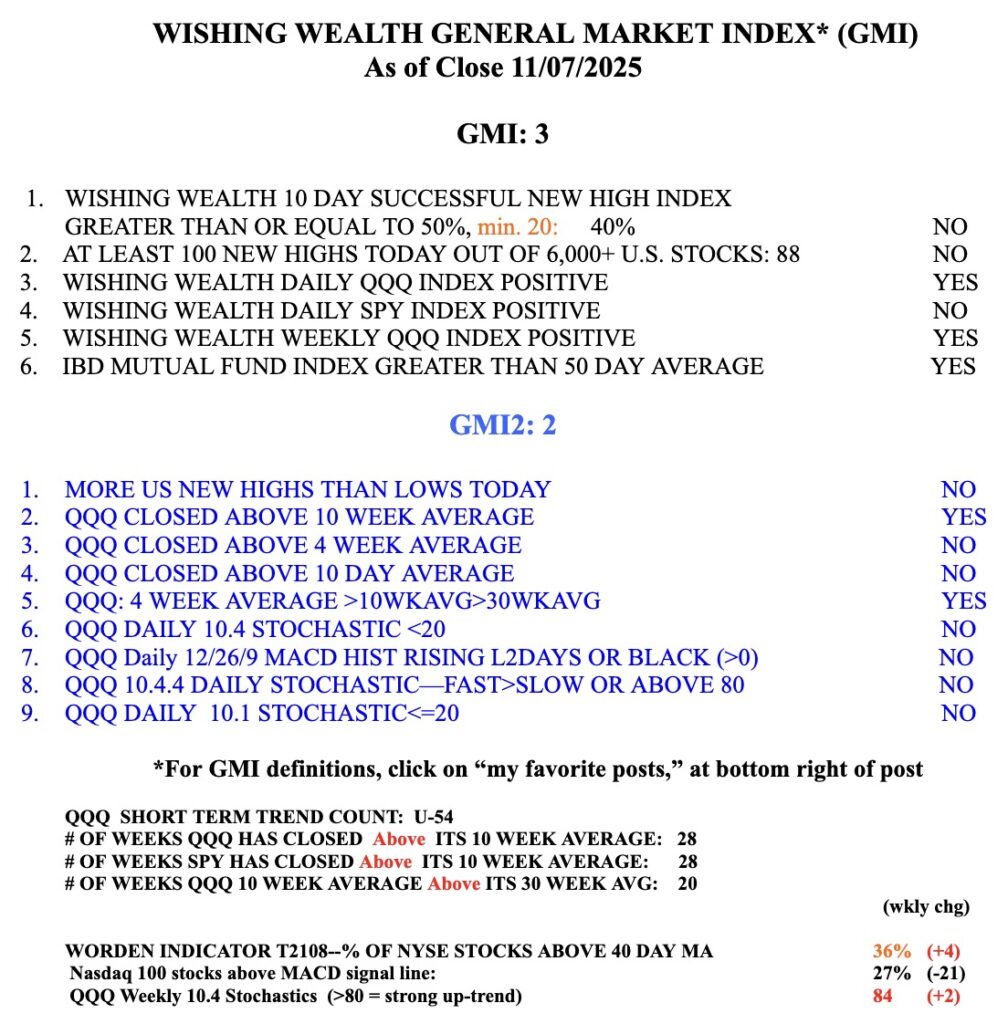
11/07/2025,why daily qqq index positive is yes?but daily spy is no? What is the defining standard of ‘positive’?Looking at the candlestick charts, I don’t see any significant differences between SPY and QQQ; their trading volumes look pretty similar too.