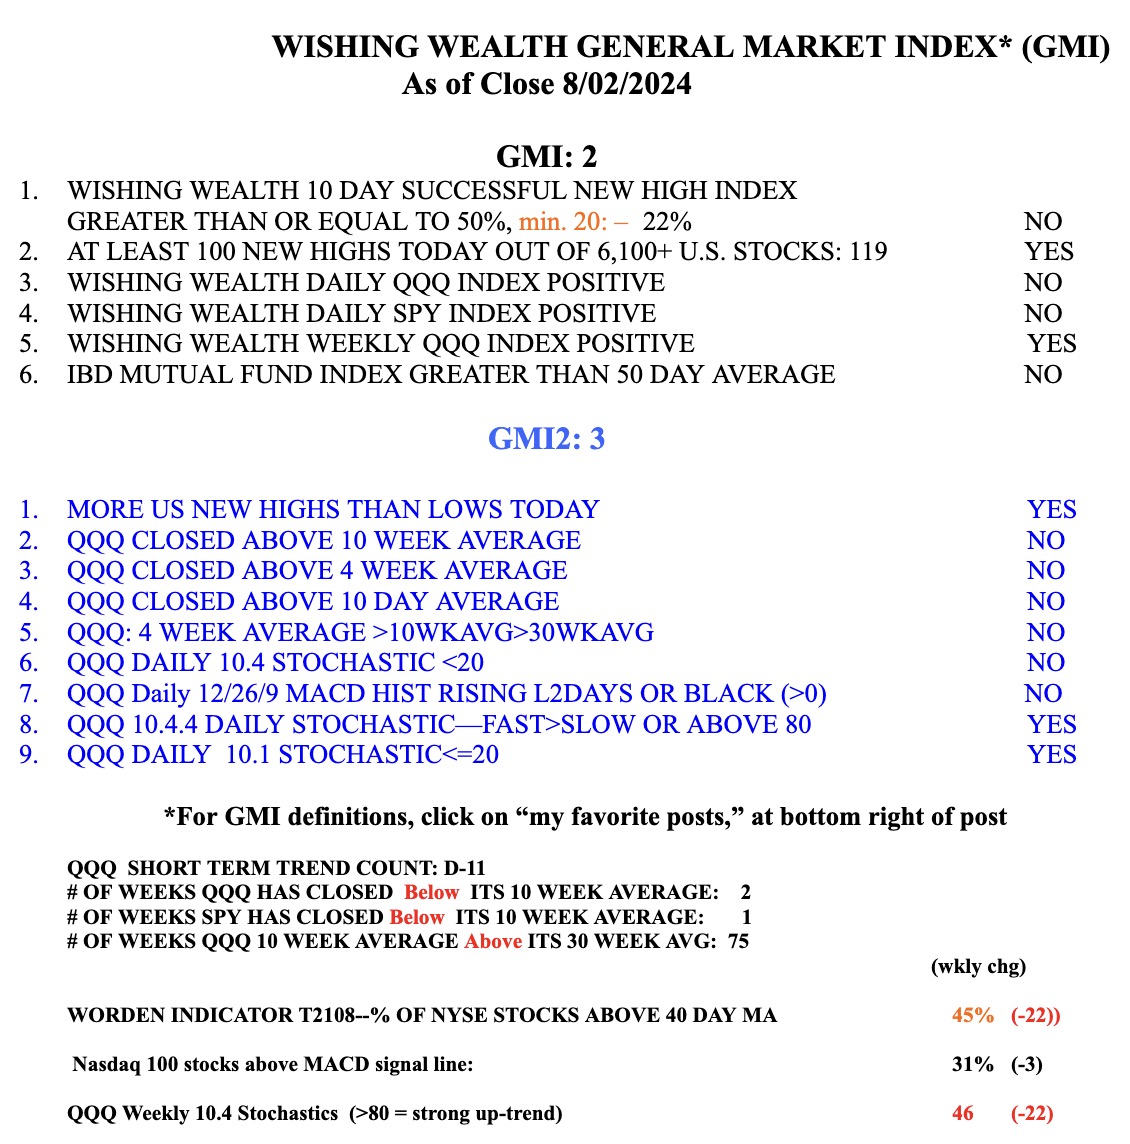
The 10:30 weekly chart shows that QQQ is now sitting on its rising 30 week average (solid red line). This is still a Stage 2 up-trend. The gray line shows the weekly closes. The longer term up-trend remains intact until the 10 week average (dotted line) crosses below the 30 week average. However, the first sign of weakness is a weekly close below the 30 week average. If the 30 week average should turn down it is a sign for me to get out of the mutual funds in my university retirement accounts. However, I have been largely in cash in my trading accounts since the short term down-trend began on July 19. I focus only on the movement of the index to determine the market’s trend.

SPY and QQQ have now both closed below their 10 week averages. Two consecutive days with the GMI<3 begins a RED period.