So many pundits claim that the markets are due for a decline. Instead of predicting Mr. Market, we would do better to just react to what he is doing. These 10:30 weekly charts look strong to me. The gray line is the weekly close and the dotted line is the 10 week moving average. The solid red line is the critical 30 week moving average of weekly closes. Compare the 2022 decline to the present trend. What do you see? Both the charts of $QQQ and $SPY tell me the same story. There is plenty of time to exit when the 10 week closes repeatedly below the 30 week.


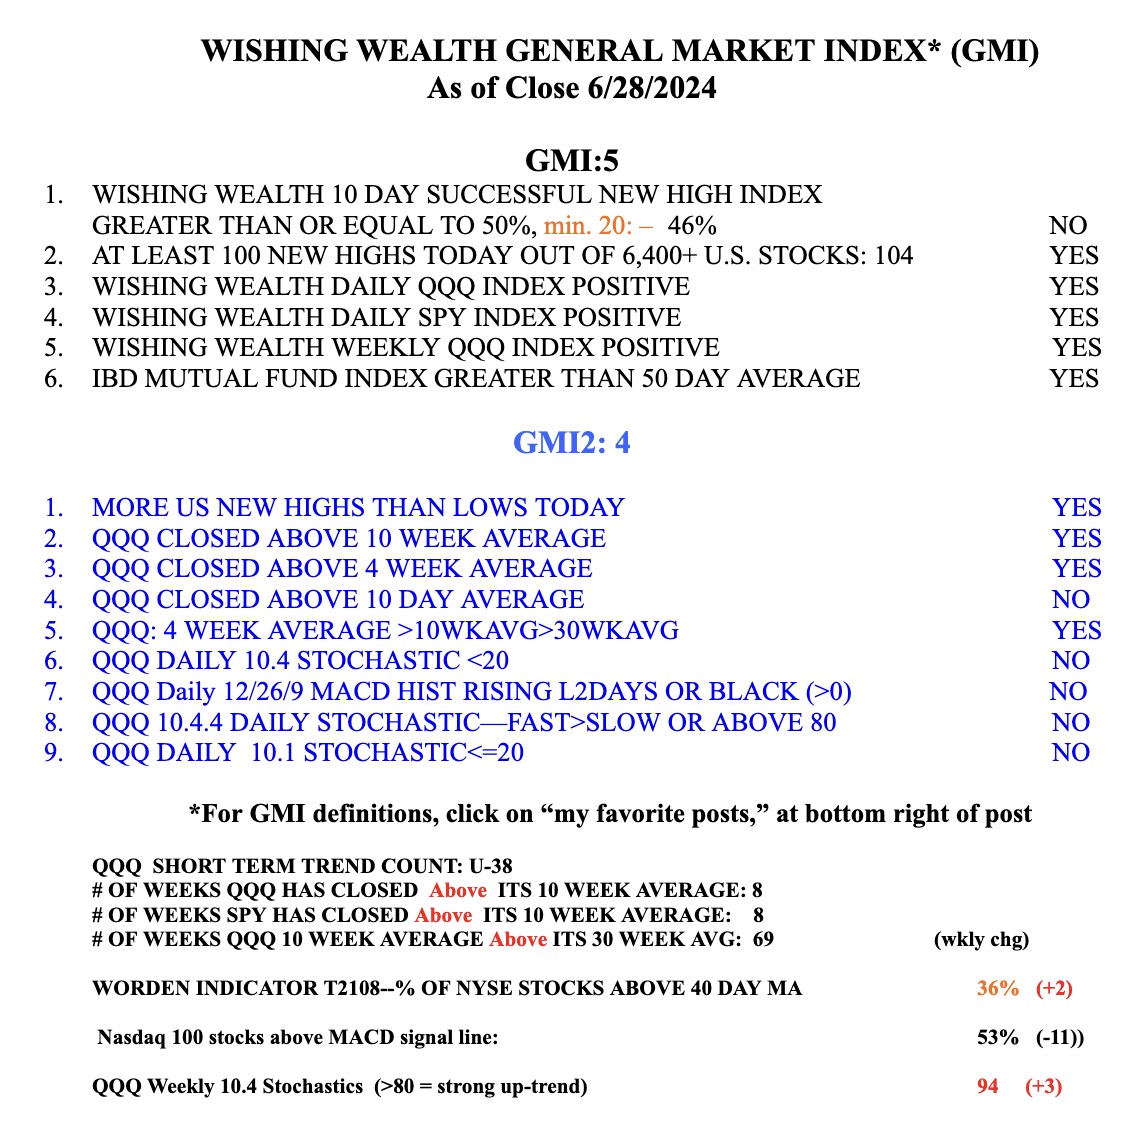
The GMI remains Green at 5 (of 6).