I have had increasing success buying stocks that come up in my weekly green bar scan. Why weekly? Because the daily chart has so many ups and downs each day that it shakes me out of a good up-trending stock. Ever happen to you? It is noteworthy that almost all of WON’s charts in his classic book are weekly charts. I believe he used to say that weekly charts show the trend better. I agree. If I focus on a stocks’s weekly chart even within the week, I can see if the up-trend is being violated. Many times a decline during the week on a daily chart really does not look so bad on the weekly chart. Focusing on the weekly chart takes the time pressure off me. I can make most of my decisions late Friday or over the weekend when I have the complete weekly price bar. I have maintained an active professional career in addition to my trading.
The best way for me to explain what I am suggesting is to review the weekly chart of a strong stock, ANF. This shows a stock in a strong up-trend for many weeks, followed by a brief correction and then a renewed up-trend. On my weekly chart I have 3 moving averages, 4wk (red dot) 10wk (blue dot)and 30 wk (solid red). I also have the weekly 10.4 and 10.4.4 stochastics as invaluable indicators of the strength of an up-trend.
An advancing stock must have the 4wk>10wk>30wk averages. This began for ANF in mid-June 2023 and lasted through April, 2024. During this period ANF never closed below its 10 week average. It did bounce up off of the 10 week average, a favorite setup of the CAN SLIM crowd, 4 times. However, ANF bounced up off of its rising 4 wk average, designated by green price bars over 20 times, offering many more chances for an entry. Further, notice that the 10.4 weekly stochastic remained above 80 the entire time until the little correction in April 2024. This is important because this weekly stochastic measures where the current price is compared to its range over the past 10 weeks. A weekly stochastic over 80 is not an overbought condition. In an advancing stock we want the the current stock price to remain above 80% of its range during the prior 10 weeks. (This description is an oversimplification of the 10.4 and 10.4.4 stochastic.)
Hence my weekly green bar setup: The stock must have had its weekly 10.4 stochastic close above 80 for at least 5 weeks and the 4wk>10wk>30wk and the stock is at least up 50% from a year ago and reached a recent ATH and had a weekly green bar the most recent week. I sell if the stock closes the week below the 10 week average or the 4 week average is declining below the 10 week average. I also may sell if the stock trades below the low of the most recent green bar or the green bar at which I bought. I can put a sell stop in at that level if I bought after a green bar.
ANF has come out of the mini-correction and now has its 4wk avg>10 wk avg and had a weekly green bar a week ago and closed last week at an ATH. Its weekly 10.4 stochastic is now above 80. ANF could be starting a new multi-week advance. If not, I would be stopped out quickly. ANF reports earnings on 5/29.

Now analyze VST.

These 12 stocks came up in my current weekly green bar scan. Check out their weekly charts with the 4/10/30 week averages.

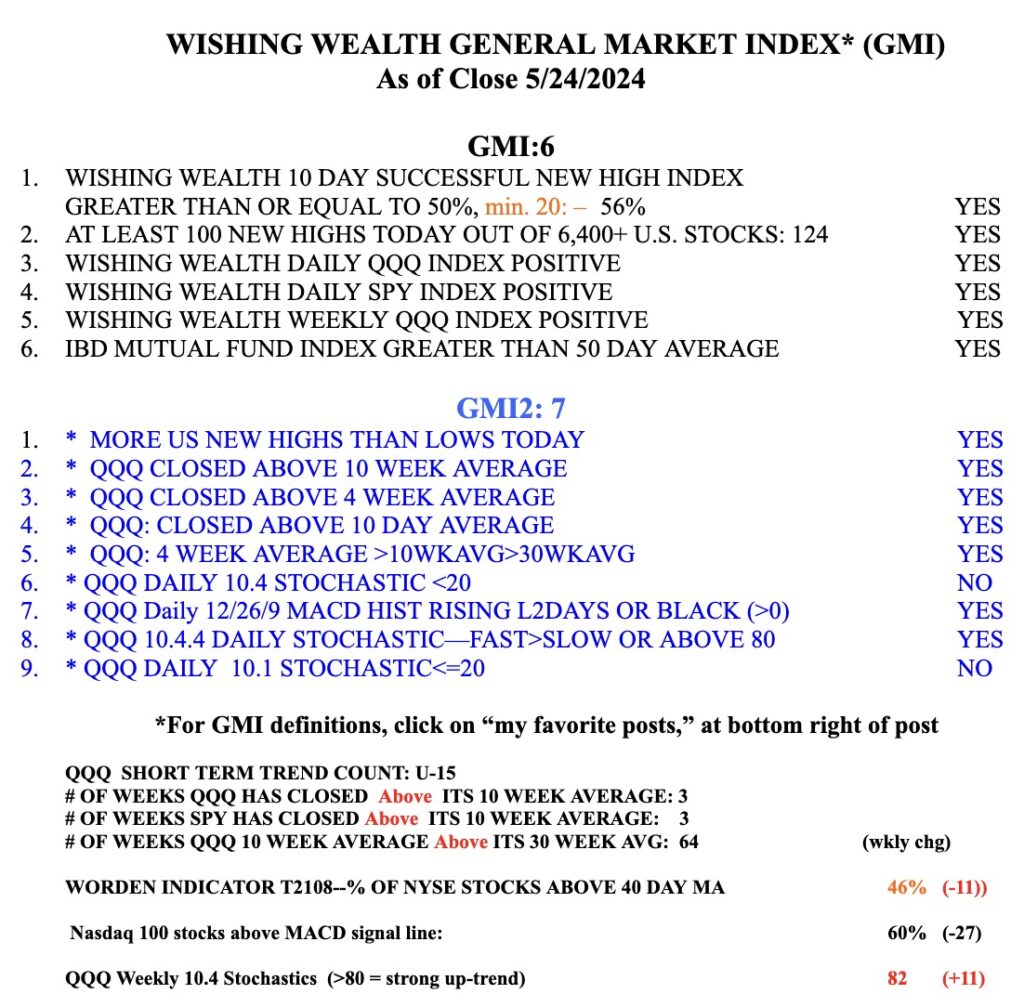
Of course , my weekly green bar setup requires an up-trending market, like the current one: GMI=GREEN and a current QQQ short term up-trend (see table below). Note that QQQ currently has a weekly 10.4 stochastic= 82. However, the recent bar is floating above the 4 wk avg, a sign of it possibly being extended. Look at this chart to see what happened when the weekly bar was floating above its 4 wk avg. It typically came back to kiss it.


Thanks again for sharing your valuable ideas.
Appreciate so much you taking the time to share your knowledge Dr. Wish.